Julian PT Higgins, Sandra Eldridge, Tianjing Li
Key Points:
- Non-standard designs, such as cluster-randomized trials and crossover trials, should be analysed using methods appropriate to the design.
- If the authors of studies included in the review fail to account for correlations among outcome data that arise because of the design, approximate methods can often be applied by review authors.
- A variant of the risk-of-bias assessment tool is available for cluster-randomized trials. Special attention should be paid to the potential for bias arising from how individual participants were identified and recruited within clusters.
- A variant of the risk-of-bias assessment tool is available for crossover trials. Special attention should be paid to the potential for bias arising from carry-over of effects from one period to the subsequent period of the trial, and to the possibility of ‘period effects’.
- To include a study with more than two intervention groups in a meta-analysis, a recommended approach is (i) to omit groups that are not relevant to the comparison being made, and (ii) to combine multiple groups that are eligible as the experimental or comparator intervention to create a single pair-wise comparison. Alternatively, multi-arm studies are dealt with appropriately by network meta-analysis.
This chapter should be cited as: Higgins JPT, Eldridge S, Li T (editors). Chapter 23: Including variants on randomized trials. In: Higgins JPT, Thomas J, Chandler J, Cumpston M, Li T, Page MJ, Welch VA (editors). Cochrane Handbook for Systematic Reviews of Interventions version 6.0 (updated July 2019). Cochrane, 2019. Available from www.training.cochrane.org/handbook.
23.1 Cluster-randomized trials
23.1.1 Introduction
In cluster-randomized trials, groups of individuals rather than individuals are randomized to different interventions. We say the ‘unit of allocation’ is the cluster, or the group. The groups may be, for example, schools, villages, medical practices or families. Cluster-randomized trials may be done for one of several reasons. It may be to evaluate the group effect of an intervention, for example herd-immunity of a vaccine. It may be to avoid ‘contamination’ across interventions when trial participants are managed within the same setting, for example in a trial evaluating training of clinicians in a clinic. A cluster-randomized design may be used simply for convenience.
One of the main consequences of a cluster design is that participants within any one cluster often tend to respond in a similar manner, and thus their data can no longer be assumed to be independent. It is important that the analysis of a cluster-randomized trial takes this issue into account. Unfortunately, many studies have in the past been incorrectly analysed as though the unit of allocation had been the individual participants (Eldridge et al 2008). This is often referred to as a ‘unit-of-analysis error’ (Whiting-O’Keefe et al 1984) because the unit of analysis is different from the unit of allocation. If the clustering is ignored and cluster-randomized trials are analysed as if individuals had been randomized, resulting confidence intervals will be artificially narrow and P values will be artificially small. This can result in false-positive conclusions that the intervention had an effect. In the context of a meta-analysis, studies in which clustering has been ignored will receive more weight than is appropriate.
In some trials, individual people are allocated to interventions that are then applied to multiple parts of those individuals (e.g. to both eyes or to several teeth), or repeated observations are made on a participant. These body parts or observations are then clustered within individuals in the same way that individuals can be clustered within, for example, medical practices. If the analysis is by the individual units (e.g. each tooth or each observation) without taking into account that the data are clustered within participants, then a unit-of-analysis error can occur.
There are several useful sources of information on cluster-randomized trials (Murray and Short 1995, Donner and Klar 2000, Eldridge and Kerry 2012, Campbell and Walters 2014, Hayes and Moulton 2017). A detailed discussion of incorporating cluster-randomized trials in a meta-analysis is available (Donner and Klar 2002), as is a more technical treatment of the problem (Donner et al 2001). Evidence suggests that many cluster-randomized trials have not been analysed appropriately when included in Cochrane Reviews (Richardson et al 2016).
23.1.2 Assessing risk of bias in cluster-randomized trials
A detailed discussion of risk-of-bias issues is provided in Chapter 7, and for the most part the Cochrane risk-of-bias tool for randomized trials, as outlined in Chapter 8, applies to cluster-randomized trials.
A key difference between cluster-randomized trials and individually randomized trials is that the individuals of interest (those within the clusters) may not be directly allocated to one intervention or another. In particular, sometimes the individuals are recruited into the study (or otherwise selected for inclusion in the analysis) after the interventions have been allocated to clusters, creating the potential for knowledge of the allocation to influence whether individuals are recruited or selected into the analysis (Puffer et al 2003, Eldridge et al 2008). The bias that arises when this occurs is referred to in various ways, but we use the term identification/recruitment bias, which distinguishes it from other types of bias. Careful trial design can protect against this bias (Hahn et al 2005, Eldridge et al 2009a).
A second key difference between cluster-randomized trials and individually randomized trials is that identifying who the ‘participants’ are is not always straightforward in cluster-randomized trials. The reasons for this are that in some trials:
-
there may be no formal recruitment of participants;
-
there may be two or more different groups of participants on whom different outcomes are measured (e.g. outcomes measured on clinicians and on patients); or
- data are collected at two or more time points on different individuals (e.g. measuring physical activity in a community using a survey, which reaches different individuals at baseline and after the intervention).
For the purposes of an assessment of risk of bias using the RoB 2 tool (see Chapter 8) we define participants in cluster-randomized trials as those on whom investigators seek to measure the outcome of interest.
The RoB 2 tool has a variant specifically for cluster-randomized trials. To avoid very general language, it focuses mainly on cluster-randomized trials in which groups of individuals form the clusters (rather than body parts or time points). Because most cluster-randomized trials are pragmatic in nature and aim to support high-level decisions about health care, the tool currently considers only the effect of assignment to intervention (and not the effect of adhering to the interventions as they were intended). Special issues in assessing risk of bias in cluster-randomized trials using RoB 2 are provided in Table 23.1.a.
Table 23.1.a Issues addressed in the Cochrane risk-of-bias tool for cluster-randomized trials
|
Bias domain |
Additional or different issues compared with individually randomized trials |
|
Bias arising from the randomization process |
|
|
Bias arising from the timing of identification and recruitment of participants |
|
|
Bias due to deviations from intended interventions |
When the review authors’ interest is in the effect of assignment to intervention (see Chapter 8, Section 8.4):
|
|
Bias due to missing outcome data |
|
|
Bias in measurement of the outcome |
|
|
Bias in selection of the reported result |
|
|
* For the precise wording of signalling questions and guidance for answering each one, see the full risk-of-bias tool at www.riskofbias.info. |
|
23.1.3 Methods of analysis for cluster-randomized trials
One way to avoid a unit-of-analysis error in a cluster-randomized trial is to conduct the analysis at the same level as the allocation. That is, the data could be analysed as if each cluster was a single individual, using a summary measurement from each cluster. Then the sample size for the analysis is the number of clusters. However, this strategy might unnecessarily reduce the precision of the effect estimate if the clusters vary in their size.
Alternatively, statistical analysis at the level of the individual can lead to an inappropriately high level of precision in the analysis, unless methods are used to account for the clustering in the data. The ideal information to extract from a cluster-randomized trial is a direct estimate of the required effect measure (e.g. an odds ratio with its confidence interval) from an analysis that properly accounts for the cluster design. Such an analysis might be based on a multilevel model or may use generalized estimating equations, among other techniques. Statistical advice is recommended to determine whether the method used is appropriate. When the study authors have not conducted such an analysis, there are two approximate approaches that can be used by review authors to adjust the results (see Sections 23.1.4 and 23.1.5).
Effect estimates and their standard errors from correct analyses of cluster-randomized trials may be meta-analysed using the generic inverse-variance approach (e.g. in RevMan).
23.1.4 Approximate analyses of cluster-randomized trials for a meta-analysis: effective sample sizes
Unfortunately, many cluster-randomized trials have in the past failed to report appropriate analyses. They are commonly analysed as if the randomization was performed on the individuals rather than the clusters. If this is the situation, approximately correct analyses may be performed if the following information can be extracted:
- the number of clusters (or groups) randomized to each intervention group and the total number of participants in the study; or the average (mean) size of each cluster;
- the outcome data ignoring the cluster design for the total number of individuals (e.g. the number or proportion of individuals with events, or means and standard deviations for continuous data); and
- an estimate of the intracluster (or intraclass) correlation coefficient (ICC).
The ICC is an estimate of the relative variability within and between clusters (Eldridge and Kerry 2012). Alternatively it describes the ‘similarity’ of individuals within the same cluster (Eldridge et al 2009b). In spite of recommendations to report the ICC in all trial reports (Campbell et al 2012), ICC estimates are often not available in published reports.
A common approach for review authors is to use external estimates obtained from similar studies, and several resources are available that provide examples of ICCs (Ukoumunne et al 1999, Campbell et al 2000, Health Services Research Unit 2004), or use an estimate based on known patterns in ICCs for particular types of cluster or outcome. ICCs may appear small compared with other types of correlations: values lower than 0.05 are typical. However, even small values can have a substantial impact on confidence interval widths (and hence weights in a meta-analysis), particularly if cluster sizes are large. Empirical research has observed that clusters that tend to be naturally larger have smaller ICCs (Ukoumunne et al 1999). For example, for the same outcome, regions are likely to have smaller ICCs than towns, which are likely to have smaller ICCs than families.
An approximately correct analysis proceeds as follows. The idea is to reduce the size of each trial to its ‘effective sample size’ (Rao and Scott 1992). The effective sample size of a single intervention group in a cluster-randomized trial is its original sample size divided by a quantity called the ‘design effect’. The design effect is approximately
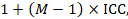
where M is the average cluster size and ICC is the intracluster correlation coefficient. When cluster sizes vary, M can be estimated more appropriately in other ways (Eldridge et al 2006). A common design effect is usually assumed across intervention groups. For dichotomous data, both the number of participants and the number experiencing the event should be divided by the same design effect. Since the resulting data must be rounded to whole numbers for entry into meta-analysis software such as RevMan, this approach may be unsuitable for small trials. For continuous data, only the sample size need be reduced; means and standard deviations should remain unchanged. Special considerations for analysis of standardized mean differences from cluster-randomized trials are discussed by White and Thomas (White and Thomas 2005).
23.1.4.1 Example of incorporating a cluster-randomized trial
As an example, consider a cluster-randomized trial that randomized 10 school classrooms with 295 children into a treatment group and 11 classrooms with 330 children into a control group. Suppose the numbers of successes among the children, ignoring the clustering, are:
Treatment: 63/295
Control: 84/330.
Imagine an intracluster correlation coefficient of 0.02 has been obtained from a reliable external source or is expected to be a good estimate, based on experience in the area. The average cluster size in the trial is
(295 + 330) ÷ (10 + 11) = 29.8.
The design effect for the trial as a whole is then
1 + (M – 1) ICC = 1 + (29.8 – 1) × 0.02 = 1.576.
The effective sample size in the treatment group is
295 ÷ 1.576 = 187.2
and for the control group is
330 ÷ 1.576 = 209.4.
Applying the design effects also to the numbers of events (in this case, successes) produces the following modified results:
Treatment: 40.0/187.2
Control: 53.3/209.4.
Once trials have been reduced to their effective sample size, the data may be entered into statistical software such as RevMan as, for example, dichotomous outcomes or continuous outcomes. Rounding the results to whole numbers, the results from the example trial may be entered as:
Treatment: 40/187
Control: 53/209.
23.1.5 Approximate analyses of cluster-randomized trials for a meta-analysis: inflating standard errors
A clear disadvantage of the method described in Section 23.1.4 is the need to round the effective sample sizes to whole numbers. A slightly more flexible approach, which is equivalent to calculating effective sample sizes, is to multiply the standard error of the effect estimate (from an analysis ignoring clustering) by the square root of the design effect. The standard error may be calculated from the confidence interval of any effect estimate derived from an analysis ignoring clustering (see Chapter 6, Sections 6.3.1 and 6.3.2). Standard analyses of dichotomous or continuous outcomes may be used to obtain these confidence intervals using standard meta-analysis software (e.g. RevMan). The meta-analysis using the inflated variances may be performed using the generic inverse-variance method.
As an example, the odds ratio (OR) from a study with the results
Treatment: 63/295
Control: 84/330
is OR=0.795 (95% CI 0.548 to 1.154). Using methods described in Chapter 6 (Section 6.3.2), we can determine from these results that the log odds ratio is lnOR=–0.23 with standard error 0.19. Using the same design effect of 1.576 as in Section 23.1.4.1, an inflated standard error that accounts for clustering is given by 0.19×√1.576=0.24. The log odds ratio (–0.23) and this inflated standard error (0.24) may be used as the basis for a meta-analysis using a generic inverse-variance approach.
23.1.6 Issues in the incorporation of cluster-randomized trials
Cluster-randomized trials may, in principle, be combined with individually randomized trials in the same meta-analysis. Consideration should be given to the possibility of important differences in the effects being evaluated between the different types of trial. There are often good reasons for performing cluster-randomized trials and these should be examined. For example, in the treatment of infectious diseases an intervention applied to all individuals in a community may be more effective than treatment applied to select (randomized) individuals within the community, since it may reduce the possibility of re-infection (Eldridge and Kerry 2012).
Authors should always identify any cluster-randomized trials in a review and explicitly state how they have dealt with the data. They should conduct sensitivity analyses to investigate the robustness of their conclusions, especially when ICCs have been borrowed from external sources (see Chapter 10, Section 10.14). Statistical support is recommended.
23.1.7 Stepped-wedge trials
In a stepped-wedge trial, randomization is by cluster. However, rather than assign a predefined proportion of the clusters to the experimental intervention and the rest to a comparator intervention, a stepped-wedge design starts with all clusters allocated to the comparator intervention and sequentially randomizes individual clusters (or groups of clusters) to switch to the experimental intervention. By the end of the trial, all clusters are implementing the experimental intervention (Hemming et al 2015). Stepped-wedge trials are increasingly used to evaluate health service and policy interventions, and are often attractive to policy makers because all clusters can expect to receive (or implement) the experimental intervention.
The analysis of a stepped-wedge trial must take into account the possibility of time trends. A naïve comparison of experimental intervention periods with comparator intervention periods will be confounded by any variables that change over time, since more clusters are receiving the experimental intervention during the later stages of the trial.
The RoB 2 tool for cluster-randomized trials can be used to assess risk of bias in a stepped-wedge trial. However, the tool does not address the need to adjust for time trends in the analysis, which is an important additional source of potential bias in a stepped-wedge trial.
23.1.8 Individually randomized trials with clustering
Issues related to clustering can also occur in individually randomized trials. This can happen when the same health professional (e.g. doctor, surgeon, nurse or therapist) delivers the intervention to a number of participants in the intervention group. This type of clustering raises issues similar to those in cluster-randomized trials in relation to the analysis (Lee and Thompson 2005, Walwyn and Roberts 2015, Walwyn and Roberts 2017), and review authors should consider inflating the variance of the intervention effect estimate using a design effect, as for cluster-randomized trials.
23.2 Crossover trials
23.2.1 Introduction
Parallel-group trials allocate each participant to a single intervention for comparison with one or more alternative interventions. In contrast, crossover trials allocate each participant to a sequence of interventions. A simple randomized crossover design is an ‘AB/BA’ design in which participants are randomized initially to intervention A or intervention B, and then ‘cross over’ to intervention B or intervention A, respectively. It can be seen that data from the first period of a crossover trial represent a parallel-group trial, a feature referred to in Section 23.2.6. In keeping with the rest of the Handbook, we will use E and C to refer to interventions, rather than A and B.
Crossover designs offer a number of possible advantages over parallel-group trials. Among these are that:
-
each participant acts as his or her own control, significantly reducing between-participant variation;
-
consequently, fewer participants are usually required to obtain the same precision in estimation of intervention effects; and
- every participant receives every intervention, which allows the determination of the best intervention or preference for an individual participant.
In some trials, randomization of interventions takes place within individuals, with different interventions being applied to different body parts (e.g. to the two eyes or to teeth in the two sides of the mouth). If body parts are randomized and the analysis is by the multiple parts within an individual (e.g. each eye or each side of the mouth) then the analysis should account for the pairing (or matching) of parts within individuals in the same way that pairing of intervention periods is recognized in the analysis of a crossover trial.
A readable introduction to crossover trials is given by Senn (Senn 2002). More detailed discussion of meta-analyses involving crossover trials is provided by Elbourne and colleagues (Elbourne et al 2002), and some empirical evidence on their inclusion in systematic reviews by Lathyris and colleagues (Lathyris et al 2007). Evidence suggests that many crossover trials have not been analysed appropriately when included in Cochrane Reviews (Nolan et al 2016).
23.2.2 Assessing suitability of crossover trials
Crossover trials are suitable for evaluating interventions with a temporary effect in the treatment of stable, chronic conditions (at least over the time period under study). They are employed, for example, in the study of interventions to relieve asthma, rheumatoid arthritis and epilepsy. There are many situations in which a crossover trial is not appropriate. These include:
-
if the medical condition evolves over time, such as a degenerative disorder, a temporary condition that will resolve within the time frame of the trial, or a cyclic disorder;
-
when an intervention (or its cessation) can lead to permanent or long-term modification (e.g. a vaccine). In this situation, either a participant will be unable (or ineligible) to enter a subsequent period of the trial; or a ‘carry-over’ effect is likely (see Section 23.2.3);
-
if the elimination half-life of a drug is very long so that a ‘carry-over’ effect is likely (see Section 23.2.3); and
- if wash-out itself induces a withdrawal or rebound effect in the second period.
In considering the inclusion of crossover trials in meta-analysis, authors should first address the question of whether a crossover trial is a suitable method for the condition and intervention in question. For example, one group of authors decided that crossover trials were inappropriate for studies in Alzheimer’s disease (although they are frequently employed in the field) due to the degenerative nature of the condition, and included only data from the first period of crossover trials in their systematic review (Qizilbash et al 1998). The second question to be addressed is whether there is a likelihood of serious carry-over, which relies largely on judgement since the statistical techniques to demonstrate carry-over are far from satisfactory. The nature of the interventions and the length of any wash-out period are important considerations.
It is only justifiable to exclude crossover trials from a systematic review if the design is inappropriate to the clinical context. Very often, however, even where the design has been appropriate, it is difficult or impossible to extract suitable data from a crossover trial. In Section 23.2.6 we outline some considerations and suggestions for including crossover trials in a meta-analysis.
23.2.3 Assessing risk of bias in crossover trials
The principal problem associated with crossover trials is that of carry-over (a type of period-by-intervention interaction). Carry-over is the situation in which the effects of an intervention given in one period persist into a subsequent period, thus interfering with the effects of the second intervention. These effects may be because the first intervention itself persists (such as a drug with a long elimination half-life), or because the effects of the intervention persist. An extreme example of carry-over is when a key outcome of interest is irreversible or of long duration, such as mortality, or pregnancy in a subfertility study. In this case, a crossover study is generally considered to be inappropriate. A carry-over effect means that the observed difference between the treatments depends upon the order in which they were received; hence the estimated overall treatment effect will be affected (usually under-estimated, leading to a bias towards the null). Many crossover trials include a period between interventions known as a wash-out period as a means of reducing carry-over.
A second problem that may occur in crossover trials is period effects. Period effects are systematic differences between responses in the second period compared with responses in the first period that are not due to different interventions. They may occur, for example, when the condition changes systematically over time, or if there are changes in background factors such as underlying healthcare strategies. For an AB/BA design, period effects can be overcome by ensuring the same number of participants is randomized to the two sequences of interventions or by including period effects in the statistical model.
A third problem for crossover trials is that the trial might report only analyses based on the first period. Although the first period of a crossover trial is in effect a parallel group comparison, use of data from only the first period will be biased if, as is likely, the decision to use first period data is based on a test for carry-over. Such a ‘two-stage analysis’ has been discredited but is still used (Freeman 1989). This is because the test for carry-over is affected by baseline differences in the randomized groups at the start of the crossover trial, so a statistically significant result might reflect such baseline differences. Reporting only the first period data in this situation is particularly problematic. Crossover trials for which only first period data are available should be considered to be at risk of bias, especially when the investigators explicitly report using a two-stage analysis strategy.
Another potential problem with crossover trials is the risk of dropout due to their longer duration compared with comparable parallel-group trials. The analysis techniques for crossover trials with missing observations are limited.
The Cochrane risk-of-bias tool for randomized trials (RoB 2, see Chapter 8) has a variant specifically for crossover trials. It focuses on crossover trials with two intervention periods rather than with two body parts. Carry-over effects are addressed specifically. Period effects are addressed through examination of the allocation ratio and the approach to analysis. The tool also addresses the possibility of selective reporting of first period results in the domain 'Bias in selection of the reported result'. Special issues in assessing risk of bias in a crossover trials using RoB 2 are provided in Table 23.2.a.
Table 23.2.a Issues addressed in version 2 of the Cochrane risk-of-bias tool for randomized crossover trials
|
Bias domain |
Additional or different issues addressed compared with parallel-group trials |
|
Bias arising from the randomization process |
|
|
Bias due to deviations from intended interventions |
|
|
Bias due to missing outcome data |
|
|
Bias in measurement of the outcome |
|
|
Bias in selection of the reported result |
|
|
* For the precise wording of signalling questions and guidance for answering each one, see the full risk-of-bias tool at www.riskofbias.info. |
|
23.2.4 Using only the first period of a crossover trial
One option when crossover trials are anticipated in a review is to plan from the outset that only data from the first periods will be used. Including only the first intervention period of a crossover trial discards more than half of the information in the study, and often substantially more than half. A sound rationale is therefore needed for this approach, based on the inappropriateness of a crossover design (see Section 23.2.2), and not based on lack of methodological expertise.
If the review intends (from the outset) to look only at the first period of any crossover trial, then review authors should use the standard version of the RoB 2 tool for parallel group randomized trials. Review authors must, however, be alert to the potential impact of selective reporting if first-period data are reported only when carry-over is detected by the trialists. Omission of trials reporting only paired analyses (i.e. not reporting data for the first period separately) may lead to bias at the meta-analysis level. The bias will not be picked up using study-level assessments of risk of bias.
23.2.5 Methods of analysis for crossover trials
If neither carry-over nor period effects are thought to be a problem, then an appropriate analysis of continuous data from a two-period, two-intervention crossover trial is a paired t-test. This evaluates the value of ‘measurement on experimental intervention (E)’ minus ‘measurement on control intervention (C)’ separately for each participant. The mean and standard error of these difference measures are the building blocks of an effect estimate and a statistical test. The effect estimate may be included in a meta-analysis using a generic inverse-variance approach (e.g. in RevMan).
A paired analysis is possible if the data in any one of the following bullet points is available:
- individual participant data from the paper or by correspondence with the trialist;
- the mean and standard deviation (or standard error) of the participant-level differences between experimental intervention (E) and comparator intervention (C) measurements;
- the mean difference and one of the following: (i) a t-statistic from a paired t-test; (ii) a P value from a paired t-test; (iii) a confidence interval from a paired analysis;
- a graph of measurements on experimental intervention (E) and comparator intervention (C) from which individual data values can be extracted, as long as matched measurements for each individual can be identified as such.
For details see Elbourne and colleagues (Elbourne et al 2002).
Crossover trials with dichotomous outcomes require more complicated methods and consultation with a statistician is recommended (Elbourne et al 2002).
If results are available broken into subgroups by the particular sequence each participant received, then analyses that adjust for period effects are straightforward (e.g. as outlined in Chapter 3 of Senn (Senn 2002)).
23.2.6 Methods for incorporating crossover trials into a meta-analysis
Unfortunately, the reporting of crossover trials has been very variable, and the data required to include a paired analysis in a meta-analysis are often not published (Li et al 2015). A common situation is that means and standard deviations (or standard errors) are available only for measurements on E and C separately. A simple approach to incorporating crossover trials in a meta-analysis is thus to take all measurements from intervention E periods and all measurements from intervention C periods and analyse these as if the trial were a parallel-group trial of E versus C. This approach gives rise to a unit-of-analysis error (see Chapter 6, Section 6.2) and should be avoided. The reason for this is that confidence intervals are likely to be too wide, and the trial will receive too little weight, with the possible consequence of disguising clinically important heterogeneity. Nevertheless, this incorrect analysis is conservative, in that studies are under-weighted rather than over-weighted. While some argue against the inclusion of crossover trials in this way, the unit-of-analysis error might be regarded as less serious than some other types of unit-of-analysis error.
A second approach to incorporating crossover trials is to include only data from the first period. This might be appropriate if carry-over is thought to be a problem, or if a crossover design is considered inappropriate for other reasons. However, it is possible that available data from first periods constitute a biased subset of all first period data. This is because reporting of first period data may be dependent on the trialists having found statistically significant carry-over.
A third approach to incorporating inappropriately reported crossover trials is to attempt to approximate a paired analysis, by imputing missing standard deviations. We address this approach in detail in Section 23.2.7.
23.2.7 Approximate analyses of crossover trials for a meta-analysis
Table 23.2.b presents some results that might be available from a report of a crossover trial, and presents the notation we will use in the subsequent sections. We review straightforward methods for approximating appropriate analyses of crossover trials to obtain mean differences or standardized mean differences for use in meta-analysis. Review authors should consider whether imputing missing data is preferable to excluding crossover trials completely from a meta-analysis. The trade-off will depend on the confidence that can be placed on the imputed numbers, and on the robustness of the meta-analysis result to a range of plausible imputed results.
Table 23.2.b Some possible data available from the report of a crossover trial
|
Data relate to |
Core statistics |
Related, commonly reported statistics |
|
Intervention E |
N, ME, SDE |
Standard error of ME. |
|
Intervention C |
N, MC, SDC |
Standard error of MC. |
|
Difference between E and C |
N, MD, SDdiff |
Standard error of MD; Confidence interval for MD; Paired t-statistic; P value from paired t-test. |
23.2.7.1 Mean differences
The point estimate of mean difference for a paired analysis is usually available, since it is the same as for a parallel-group analysis (the mean of the differences is equal to the difference in means):

The standard error of the mean difference is obtained as
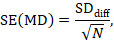
where N is the number of participants in the trial, and SDdiff is the standard deviation of within-participant differences between E and C measurements. As indicated in Section 23.2.5, the standard error can also be obtained directly from a confidence interval for MD, from a paired t-statistic, or from the P value from a paired t-test. The quantities MD and SE(MD) may be entered into a meta-analysis under the generic inverse-variance outcome type (e.g. in RevMan).
When the standard error is not available directly and the standard deviation of the differences is not presented, a simple approach is to impute the standard deviation, as is commonly done for other missing standard deviations (see Chapter 6, Section 6.5.2.7). Other studies in the meta-analysis may present standard deviations of differences, and as long as the studies use the same measurement scale, it may be reasonable to borrow these from one study to another. As with all imputations, sensitivity analyses should be undertaken to assess the impact of the imputed data on the findings of the meta-analysis (see Chapter 10, Section 10.14).
If no information is available from any study on the standard deviations of the within-participant differences, imputation of standard deviations can be achieved by assuming a particular correlation coefficient. The correlation coefficient describes how similar the measurements on interventions E and C are within a participant, and is a number between –1 and 1. It may be expected to lie between 0 and 1 in the context of a crossover trial, since a higher than average outcome for a participant while on E will tend to be associated with a higher than average outcome while on C. If the correlation coefficient is zero or negative, then there is no statistical benefit of using a crossover design over using a parallel-group design.
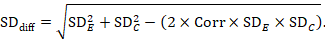
A common way of presenting results of a crossover trial is as if the trial had been a parallel-group trial, with standard deviations for each intervention separately (SDE and SDC; see Table 23.2.b). The desired standard deviation of the differences can be estimated using these intervention-specific standard deviations and an imputed correlation coefficient (Corr):
23.2.7.2 Standardized mean difference
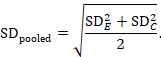
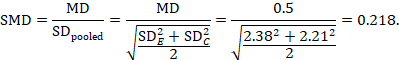
The most appropriate standardized mean difference (SMD) from a crossover trial divides the mean difference by the standard deviation of measurements (and not by the standard deviation of the differences). A SMD can be calculated by pooled intervention-specific standard deviations as follows:
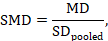
where
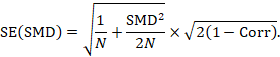
A correlation coefficient is required for the standard error of the SMD:
Alternatively, the SMD can be calculated from the MD and its standard error, using an imputed correlation:
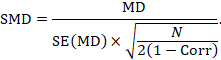
In this case, the imputed correlation impacts on the magnitude of the SMD effect estimate itself (rather than just on the standard error, as is the case for MD analyses in Section 23.2.7.1). Imputed correlations should therefore be used with great caution for estimation of SMDs.
23.2.7.3 Imputing correlation coefficients
The value for a correlation coefficient might be imputed from another study in the meta-analysis (see below), it might be imputed from a source outside of the meta-analysis, or it might be hypothesized based on reasoned argument. In all of these situations, a sensitivity analysis should be undertaken, trying different plausible values of Corr, to determine whether the overall result of the analysis is robust to the use of imputed correlation coefficients.
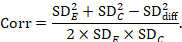
Estimation of a correlation coefficient is possible from another study in the meta-analysis if that study presents all three standard deviations in Table 23.2.b. The calculation assumes that the mean and standard deviation of measurements for intervention E is the same when it is given in the first period as when it is given in the second period (and similarly for intervention C).
Before imputation is undertaken it is recommended that correlation coefficients are computed for as many studies as possible and compared. If these correlations vary substantially then sensitivity analyses are particularly important.
23.2.7.4 Example
As an example, suppose a crossover trial reports the following data:
|
Intervention E (sample size 10) |
ME = 7.0, SDE = 2.38 |
|
Intervention C (sample size 10) |
MC = 6.5, SDC = 2.21 |
Mean difference, imputing SD of differences (SDdiff)
The estimate of the mean difference is MD=7.0–6.5=0.5. Suppose that a typical standard deviation of differences had been observed from other trials to be 2. Then we can estimate the standard error of MD as

The numbers 0.5 and 0.632 may be entered into RevMan as the estimate and standard error of a mean difference, under a generic inverse-variance outcome.
Mean difference, imputing correlation coefficient (Corr)
The estimate of the mean difference is again MD=0.5. Suppose that a correlation coefficient of 0.68 has been imputed. Then we can impute the standard deviation of the differences as:
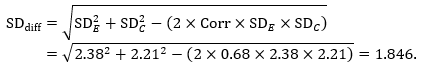
The standard error of MD is then

The numbers 0.5 and 0.583 may be entered into a meta-analysis as the estimate and standard error of a mean difference, under a generic inverse-variance outcome. Correlation coefficients other than 0.68 should be used as part of a sensitivity analysis.
Standardized mean difference, imputing correlation coefficient (Corr)
The standardized mean difference can be estimated directly from the data:
The standard error is obtained thus:
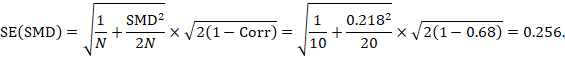
The numbers 0.218 and 0.256 may be entered into a meta-analysis as the estimate and standard error of a standardized mean difference, under a generic inverse-variance outcome.
We could also have obtained the SMD from the MD and its standard error:
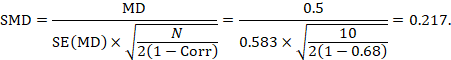
The minor discrepancy arises due to the slightly different ways in which the two formulae calculate a pooled standard deviation for the standardizing.
23.2.8 Issues in the incorporation of crossover trials
Crossover trials may, in principle, be combined with parallel-group trials in the same meta-analysis. Consideration should be given to the possibility of important differences in other characteristics between the different types of trial. For example, crossover trials may have shorter intervention periods or may include participants with less severe illness. It is generally advisable to meta-analyse parallel-group and crossover trials in separate subgroups, irrespective of whether they are also combined.
Review authors should explicitly state how they have dealt with data from crossover trials and should conduct sensitivity analyses to investigate the robustness of their conclusions, especially when correlation coefficients have been borrowed from external sources (see Chapter 10, Section 10.14). Statistical support is recommended.
23.2.9 Cluster crossover trials
A cluster crossover trial combines aspects of a cluster-randomized trial (Section 23.1.1) and a crossover trial (Section 23.2.1). In a two-period, two-intervention cluster crossover trial, clusters are randomized to either the experimental intervention or the comparator intervention. At the end of the first period, clusters on the experimental intervention cross over to the comparator intervention for the second period, and clusters on the comparator intervention cross over to the experimental intervention for the second period (Rietbergen and Moerbeek 2011, Arnup et al 2017). The clusters may involve the same individuals in both periods, or different individuals in the two periods. The design introduces the advantages of a crossover design into situations in which interventions are most appropriately implemented or evaluated at the cluster level.
The analysis of a cluster crossover trial should consider both the pairing of intervention periods within clusters and the similarity of individuals within clusters. Unfortunately, many trials have not performed appropriate analyses (Arnup et al 2016), so review authors are encouraged to seek statistical advice.
The RoB 2 tool does not currently have a variant for cluster crossover trials.
23.3 Studies with more than two intervention groups
23.3.1 Introduction
It is not uncommon for clinical trials to randomize participants to one of several intervention groups. A review of randomized trials published in December 2000 found that a quarter had more than two intervention groups (Chan and Altman 2005). For example, there may be two or more experimental intervention groups with a common comparator group, or two comparator intervention groups such as a placebo group and a standard treatment group. We refer to these studies as ‘multi-arm’ studies. A special case is a factorial trial, which addresses two or more simultaneous intervention comparisons using four or more intervention groups (see Section 23.3.6).
Although a systematic review may include several intervention comparisons (and hence several meta-analyses), almost all meta-analyses address pair-wise comparisons. There are three separate issues to consider when faced with a study with more than two intervention groups.
- Determine which intervention groups are relevant to the systematic review.
- Determine which intervention groups are relevant to a particular meta-analysis.
- Determine how the study will be included in the meta-analysis if more than two groups are relevant.
23.3.2 Determining which intervention groups are relevant
For a particular multi-arm study, the intervention groups of relevance to a systematic review are all those that could be included in a pair-wise comparison of intervention groups that would meet the criteria for including studies in the review. For example, a review addressing only a comparison of nicotine replacement therapy versus placebo for smoking cessation might identify a study comparing nicotine gum versus behavioural therapy versus placebo gum. Of the three possible pair-wise comparisons of interventions in this study, only one (nicotine gum versus placebo gum) addresses the review objective, and no comparison involving behavioural therapy does. Thus, the behavioural therapy group is not relevant to the review, and can be safely left out of any syntheses. However, if the study had compared nicotine gum plus behavioural therapy versus behavioural therapy plus placebo gum versus placebo gum alone, then a comparison of the first two interventions might be considered relevant (with behavioural therapy provided as a consistent co-intervention to both groups of interest), and the placebo gum alone group might not.
As an example of multiple comparator groups, a review addressing the comparison ‘acupuncture versus no acupuncture’ might identify a study comparing ‘acupuncture versus sham acupuncture versus no intervention’. The review authors would ask whether, on the one hand, a study of ‘acupuncture versus sham acupuncture’ would be included in the review and, on the other hand, a study of ‘acupuncture versus no intervention’ would be included. If both of them would, then all three intervention groups of the study are relevant to the review.
As a general rule, and to avoid any confusion for the reader over the identity and nature of each study, it is recommended that all intervention groups of a multi-intervention study be mentioned in the table of ‘Characteristics of included studies’. However, it is necessary to provide detailed descriptions of only the intervention groups relevant to the review, and only these groups should be used in analyses.
The same considerations of relevance apply when determining which intervention groups of a study should be included in a particular meta-analysis. Each meta-analysis addresses only a single pair-wise comparison, so review authors should consider whether a study of each possible pair-wise comparison of interventions in the study would be eligible for the meta-analysis. To draw the distinction between the review-level decision and the meta-analysis-level decision, consider a review of ‘nicotine therapy versus placebo or other comparators’. All intervention groups of a study of ‘nicotine gum versus behavioural therapy versus placebo gum’ might be relevant to the review. However, the presence of multiple interventions may not pose any problem for meta-analyses, since it is likely that ‘nicotine gum versus placebo gum’, and ‘nicotine gum versus behavioural therapy’ would be addressed in different meta-analyses. Conversely, all groups of the study of ‘acupuncture versus sham acupuncture versus no intervention’ might be considered eligible for the same meta-analysis. This would be the case if the meta-analysis would otherwise include both studies of ‘acupuncture versus sham acupuncture’ and studies of ‘acupuncture versus no intervention’, treating sham acupuncture and no intervention both as relevant comparators. We describe methods for dealing with the latter situation in Section 23.3.4.
23.3.3 Risk of bias in studies with more than two groups
Bias may be introduced in a multiple-intervention study if the decisions regarding data analysis are made after seeing the data. For example, groups receiving different doses of the same intervention may be combined only after looking at the results. Also, decisions about the selection of outcomes to report may be made after comparing different pairs of intervention groups and examining the findings. These issues would be addressed in the domain ‘Bias due to selection of the reported result’ in the Cochrane risk-of-bias tool for randomized trials (RoB 2, see Chapter 8).
Juszczak and colleagues reviewed 60 multiple-intervention randomized trials, of which over a third had at least four intervention arms (Juszczak et al 2003). They found that only 64% reported the same comparisons of groups for all outcomes, suggesting selective reporting analogous to selective outcome reporting in a two-arm trial. Also, 20% reported combining groups in an analysis. However, if the summary data are provided for each intervention group, it does not matter how the groups had been combined in reported analyses; review authors do not need to analyse the data in the same way as the study authors.
23.3.4 How to include multiple groups from one study
There are several possible approaches to including a study with multiple intervention groups in a particular meta-analysis. One approach that must be avoided is simply to enter several comparisons into the meta-analysis so that the same comparator intervention group is included more than once. This ‘double-counts’ the participants in the intervention group(s) shared across more than one comparison, and creates a unit-of-analysis error due to the unaddressed correlation between the estimated intervention effects from multiple comparisons (see Chapter 6, Section 6.2). An important distinction is between situations in which a study can contribute several independent comparisons (i.e. with no intervention group in common) and when several comparisons are correlated because they have intervention groups, and hence participants, in common. For example, consider a study that randomized participants to four groups: ‘nicotine gum’ versus ‘placebo gum’ versus ‘nicotine patch’ versus ‘placebo patch’. A meta-analysis that addresses the broad question of whether nicotine replacement therapy is effective might include the comparison ‘nicotine gum versus placebo gum’ as well as the independent comparison ‘nicotine patch versus placebo patch’, with no unit of analysis error or double-counting. It is usually reasonable to include independent comparisons in a meta-analysis as if they were from different studies, although there are subtle complications with regard to random-effects analyses (see Section 23.3.5).
Approaches to overcoming a unit-of-analysis error for a study that could contribute multiple, correlated, comparisons include the following.
- Combine groups to create a single pair-wise comparison (recommended).
- Select one pair of interventions and exclude the others.
- Split the ‘shared’ group into two or more groups with smaller sample size, and include two or more (reasonably independent) comparisons.
- Include two or more correlated comparisons and account for the correlation.
- Undertake a network meta-analysis (see Chapter 11).
The recommended method in most situations is to combine all relevant experimental intervention groups of the study into a single group, and to combine all relevant comparator intervention groups into a single comparator group. As an example, suppose that a meta-analysis of ‘acupuncture versus no acupuncture’ would consider studies of either ‘acupuncture versus sham acupuncture’ or studies of ‘acupuncture versus no intervention’ to be eligible for inclusion. Then a study with three intervention groups (acupuncture, sham acupuncture and no intervention) would be included in the meta-analysis by combining the participants in the ‘sham acupuncture’ group with participants in the ‘no intervention’ group. This combined comparator group would be compared with the ‘acupuncture’ group in the usual way. For dichotomous outcomes, both the sample sizes and the numbers of people with events can be summed across groups. For continuous outcomes, means and standard deviations can be combined using methods described in Chapter 6 (Section 6.5.2.10).
The alternative strategy of selecting a single pair of interventions (e.g. choosing either ‘sham acupuncture’ or ‘no intervention’ as the comparator) results in a loss of information and is open to results-related choices, so is not generally recommended.
A further possibility is to include each pair-wise comparison separately, but with shared intervention groups divided out approximately evenly among the comparisons. For example, if a trial compares 121 patients receiving acupuncture with 124 patients receiving sham acupuncture and 117 patients receiving no acupuncture, then two comparisons (of, say, 61 ‘acupuncture’ against 124 ‘sham acupuncture’, and of 60 ‘acupuncture’ against 117 ‘no intervention’) might be entered into the meta-analysis. For dichotomous outcomes, both the number of events and the total number of patients would be divided up. For continuous outcomes, only the total number of participants would be divided up and the means and standard deviations left unchanged. This method only partially overcomes the unit-of-analysis error (because the resulting comparisons remain correlated) so is not generally recommended. A potential advantage of this approach, however, would be that approximate investigations of heterogeneity across intervention arms are possible (e.g. in the case of the example here, the difference between using sham acupuncture and no intervention as a comparator group).
Two final options are to account for the correlation between correlated comparisons from the same study in the analysis, and to perform a network meta-analysis. The former involves calculating an average (or weighted average) of the relevant pair-wise comparisons from the study, and calculating a variance (and hence a weight) for the study, taking into account the correlation between the comparisons (Borenstein et al 2008). It will typically yield a similar result to the recommended method of combining across experimental and comparator intervention groups. Network meta-analysis allows for the simultaneous analysis of multiple interventions, and so naturally allows for multi-arm studies. Network meta-analysis is discussed in more detail in Chapter 11.
23.3.5 Heterogeneity considerations with multiple-intervention studies
Two possibilities for addressing heterogeneity between studies are to allow for it in a random-effects meta-analysis, and to investigate it through subgroup analyses or meta-regression (Chapter 10, Section 10.11). Some complications arise when including multiple-intervention studies in such analyses. First, it will not be possible to investigate certain intervention-related sources of heterogeneity if intervention groups are combined as in the recommended approach in Section 23.3.4. For example, subgrouping according to ‘sham acupuncture’ or ‘no intervention’ as a comparator group is not possible if these two groups are combined prior to the meta-analysis. The simplest method for allowing an investigation of this difference, across studies, is to create two or more comparisons from the study (e.g. ‘acupuncture versus sham acupuncture’ and ‘acupuncture versus no intervention’). However, if these contain a common intervention group (here, acupuncture), then they are not independent and a unit-of-analysis error will occur, even if the sample size is reduced for the shared intervention group(s). Nevertheless, splitting up the sample size for the shared intervention group remains a practical means of performing approximate investigations of heterogeneity.
A more subtle problem occurs in random-effects meta-analyses if multiple comparisons are included from the same study. A random-effects meta-analysis allows for variation by assuming that the effects underlying the studies in the meta-analysis follow a distribution across studies. The intention is to allow for study-to-study variation. However, if two or more estimates come from the same study then the same variation is assumed across comparisons within the study and across studies. This is true whether the comparisons are independent or correlated (see Section 23.3.4). One way to overcome this is to perform a fixed-effect meta-analysis across comparisons within a study, and a random-effects meta-analysis across studies. Statistical support is recommended; in practice the difference between different analyses is likely to be trivial.
23.3.6 Factorial trials
In a factorial trial, two (or more) intervention comparisons are carried out simultaneously. Thus, for example, participants may be randomized to receive aspirin or placebo, and also randomized to receive a behavioural intervention or standard care. Most factorial trials have two ‘factors’ in this way, each of which has two levels; these are called 2x2 factorial trials. Occasionally 3x2 trials may be encountered, or trials that investigate three, four, or more interventions simultaneously. Often only one of the comparisons will be of relevance to any particular review. The following remarks focus on the 2x2 case but the principles extend to more complex designs.
In most factorial trials the intention is to achieve ‘two trials for the price of one’, and the assumption is made that the effects of the different active interventions are independent, that is, there is no interaction (synergy). Occasionally a trial may be carried out specifically to investigate whether there is an interaction between two treatments. That aspect may more often be explored in a trial comparing each of two active treatments on its own with both combined, without a placebo group. Such three intervention group trials are not factorial trials.
The 2x2 factorial design can be displayed as a 2x2 table, with the rows indicating one comparison (e.g. aspirin versus placebo) and the columns the other (e.g. behavioural intervention versus standard care):
|
Randomization of B |
|||
|
Behavioural intervention (B) |
Standard care |
||
|
Randomization of A |
Aspirin (A) |
A and B |
A, not B |
|
Placebo (not A) |
B, not A |
Not A, not B |
|
A 2x2 factorial trial can be seen as two trials addressing different questions. It is important that both parts of the trial are reported as if they were just a two-arm parallel-group trial. Thus, we expect to see the results for aspirin versus placebo, including all participants regardless of whether they had behavioural intervention or standard care, and likewise for the behavioural intervention. These results may be seen as relating to the margins of the 2x2 table. We would also wish to evaluate whether there may have been some interaction between the treatments (i.e. effect of A depends on whether B or ‘not B’ was received), for which we need to see the four cells within the table (McAlister et al 2003). It follows that the practice of publishing two separate reports, possibly in different journals, does not allow the full results to be seen.
McAlister and colleagues reviewed 44 published reports of factorial trials (McAlister et al 2003). They found that only 34% reported results for each cell of the factorial structure. However, it will usually be possible to derive the marginal results from the results for the four cells in the 2x2 structure. In the same review, 59% of the trial reports included the results of a test of interaction. On re-analysis, 2/44 trials (6%) had P <0.05, which is close to expectation by chance (McAlister et al 2003). Thus, despite concerns about unrecognized interactions, it seems that investigators are appropriately restricting the use of the factorial design to those situations in which two (or more) treatments do not have the potential for substantive interaction. Unfortunately, many review authors do not take advantage of this fact and include only half of the available data in their meta-analysis (e.g. including only aspirin versus placebo among those that were not receiving behavioural intervention, and excluding the valid investigation of aspirin among those that were receiving behavioural intervention).
When faced with factorial trials, review authors should consider whether both intervention comparisons are relevant to a meta-analysis. If only one of the comparisons is relevant, then the full comparison of all participants for that comparison should be used. If both comparisons are relevant, then both full comparisons can be included in a meta-analysis without a need to account for the double counting of participants. Additional considerations may apply if important interaction has been found between the interventions.
23.4 Chapter information
Editors: Julian PT Higgins, Sandra Eldridge, Tianjing Li
Acknowledgements: We are grateful to Doug Altman, Marion Campbell, Michael Campbell, François Curtin, Amy Drahota, Bruno Giraudeau, Barnaby Reeves, Stephen Senn and Nandi Siegfried for contributions to the material in this chapter.
23.5 References
Arnup SJ, Forbes AB, Kahan BC, Morgan KE, McKenzie JE. Appropriate statistical methods were infrequently used in cluster-randomized crossover trials. Journal of Clinical Epidemiology 2016; 74: 40–50.
Arnup SJ, McKenzie JE, Hemming K, Pilcher D, Forbes AB. Understanding the cluster randomised crossover design: a graphical illustraton of the components of variation and a sample size tutorial. Trials 2017; 18: 381.
Borenstein M, Hedges LV, Higgins JPT, Rothstein HR. Introduction to Meta-analysis. Chichester (UK): John Wiley & Sons; 2008.
Campbell M, Grimshaw J, Steen N. Sample size calculations for cluster randomised trials. Changing Professional Practice in Europe Group (EU BIOMED II Concerted Action). Journal of Health Services Research and Policy 2000; 5: 12–16.
Campbell MJ, Walters SJ. How to design, Analyse and Report Cluster Randomised Trials in Medicine and Health Related Research. Chichester (UK): John Wiley & Sons; 2014.
Campbell MK, Piaggio G, Elbourne DR, Altman DG, Group C. Consort 2010 statement: extension to cluster randomised trials. BMJ 2012; 345: e5661.
Chan AW, Altman DG. Epidemiology and reporting of randomised trials published in PubMed journals. Lancet 2005; 365: 1159–1162.
Donner A, Klar N. Design and Analysis of Cluster Randomization Trials in Health Research. London (UK): Arnold; 2000.
Donner A, Piaggio G, Villar J. Statistical methods for the meta-analysis of cluster randomized trials. Statistical Methods in Medical Research 2001; 10: 325–338.
Donner A, Klar N. Issues in the meta-analysis of cluster randomized trials. Statistics in Medicine 2002;21: 2971–2980.
Elbourne DR, Altman DG, Higgins JPT, Curtin F, Worthington HV, Vaillancourt JM. Meta-analyses involving cross-over trials: methodological issues. International Journal of Epidemiology 2002; 31: 140–149.
Eldridge S, Ashby D, Bennett C, Wakelin M, Feder G. Internal and external validity of cluster randomised trials: systematic review of recent trials. BMJ 2008; 336: 876–880.
Eldridge S, Kerry S, Torgerson DJ. Bias in identifying and recruiting participants in cluster randomised trials: what can be done? BMJ 2009a; 339: b4006.
Eldridge S, Kerry S. A Practical Guide to Cluster Randomised Trials in Health Services Research. Chichester (UK): John Wiley & Sons; 2012.
Eldridge SM, Ashby D, Kerry S. Sample size for cluster randomized trials: effect of coefficient of variation of cluster size and analysis method. International Journal of Epidemiology 2006; 35: 1292–1300.
Eldridge SM, Ukoumunne OC, Carlin JB. The intra-cluster correlation coefficient in cluster randomized trials: a review of definitions. International Statistical Review 2009b; 77: 378–394.
Freeman PR. The performance of the two-stage analysis of two-treatment, two-period cross-over trials. Statistics in Medicine 1989; 8: 1421–1432.
Hahn S, Puffer S, Torgerson DJ, Watson J. Methodological bias in cluster randomised trials. BMC Medical Research Methodology 2005; 5: 10.
Hayes RJ, Moulton LH. Cluster Randomised Trials. Boca Raton (FL): CRC Press; 2017.
Health Services Research Unit. Database of ICCs: Spreadsheet (Empirical estimates of ICCs from changing professional practice studies) [page last modified 11 Aug 2004] 2004. www.abdn.ac.uk/hsru/what-we-do/tools.
Hemming K, Haines TP, Chilton PJ, Girling AJ, Lilford RJ. The stepped wedge cluster randomised trial: rationale, design, analysis, and reporting. BMJ 2015; 350: h391.
Juszczak E, Altman D, Chan AW. A review of the methodology and reporting of multi-arm, parallel group, randomised clinical trials (RCTs). 3rd Joint Meeting of the International Society for Clinical Biostatistics and Society for Clinical Trials; London (UK) 2003.
Lathyris DN, Trikalinos TA, Ioannidis JP. Evidence from crossover trials: empirical evaluation and comparison against parallel arm trials. International Journal of Epidemiology 2007; 36: 422–430.
Lee LJ, Thompson SG. Clustering by health professional in individually randomised trials. BMJ 2005; 330: 142–144.
Li T, Yu T, Hawkins BS, Dickersin K. Design, analysis, and reporting of crossover trials for inclusion in a meta-analysis. PloS One 2015; 10: e0133023.
McAlister FA, Straus SE, Sackett DL, Altman DG. Analysis and reporting of factorial trials: a systematic review. JAMA 2003; 289: 2545–2553.
Murray DM, Short B. Intraclass correlation among measures related to alcohol-use by young-adults – estimates, correlates and applications in intervention studies. Journal of Studies on Alcohol 1995; 56: 681–694.
Nolan SJ, Hambleton I, Dwan K. The use and reporting of the cross-over study design in clinical trials and systematic reviews: a systematic assessment. PloS One 2016; 11: e0159014.
Puffer S, Torgerson D, Watson J. Evidence for risk of bias in cluster randomised trials: review of recent trials published in three general medical journals. BMJ 2003; 327: 785–789.
Qizilbash N, Whitehead A, Higgins J, Wilcock G, Schneider L, Farlow M. Cholinesterase inhibition for Alzheimer disease: a meta-analysis of the tacrine trials. JAMA 1998; 280: 1777–1782.
Rao JNK, Scott AJ. A simple method for the analysis of clustered binary data. Biometrics 1992; 48: 577–585.
Richardson M, Garner P, Donegan S. Cluster tandomised trials in Cochrane Reviews: evaluation of methodological and reporting practice. PloS One 2016; 11: e0151818.
Rietbergen C, Moerbeek M. The design of cluster randomized crossover trials. Journal of Educational and Behavioral Statistics 2011; 36: 472–490.
Senn S. Cross-over Trials in Clinical Research. 2nd ed. Chichester (UK): John Wiley & Sons; 2002.
Ukoumunne OC, Gulliford MC, Chinn S, Sterne JA, Burney PG. Methods for evaluating area-wide and organisation-based interventions in health and health care: a systematic review. Health Technology Assessment 1999; 3: 5.
Walwyn R, Roberts C. Meta-analysis of absolute mean differences from randomised trials with treatment-related clustering associated with care providers. Statistics in Medicine 2015; 34: 966–983.
Walwyn R, Roberts C. Meta-analysis of standardised mean differences from randomised trials with treatment-related clustering associated with care providers. Statistics in Medicine 2017; 36: 1043–1067.
White IR, Thomas J. Standardized mean differences in individually-randomized and cluster-randomized trials, with applications to meta-analysis. Clinical Trials 2005; 2: 141–151.
Whiting-O’Keefe QE, Henke C, Simborg DW. Choosing the correct unit of analysis in medical care experiments. Medical Care 1984; 22: 1101–1114.