Anna Chaimani, Deborah M Caldwell, Tianjing Li, Julian PT Higgins, Georgia Salanti
Key Points:
- Network meta-analysis is a technique for comparing three or more interventions simultaneously in a single analysis by combining both direct and indirect evidence across a network of studies.
- Network meta-analysis produces estimates of the relative effects between any pair of interventions in the network, and usually yields more precise estimates than a single direct or indirect estimate. It also allows estimation of the ranking and hierarchy of interventions.
- A valid network meta-analysis relies on the assumption that the different sets of studies included in the analysis are similar, on average, in all important factors that may affect the relative effects.
- Incoherence (also called inconsistency) occurs when different sources of information (e.g. direct and indirect) about a particular intervention comparison disagree.
- Grading confidence in evidence from a network meta-analysis begins by evaluating confidence in each direct comparison. Domain-specific assessments are combined to determine the overall confidence in the evidence.
Cite this chapter as: Chaimani A, Caldwell DM, Li T, Higgins JPT, Salanti G. Chapter 11: Undertaking network meta-analyses [last updated October 2019]. In: Higgins JPT, Thomas J, Chandler J, Cumpston M, Li T, Page MJ, Welch VA (editors). Cochrane Handbook for Systematic Reviews of Interventions version 6.5. Cochrane, 2024. Available from cochrane.org/handbook.
11.1 What is network meta-analysis?
Most Cochrane Reviews present comparisons between pairs of interventions (an experimental intervention and a comparator intervention) for a specific condition and in a specific population or setting. However, it is usually the case that several, perhaps even numerous, competing interventions are available for any given condition. People who need to decide between alternative interventions would benefit from a single review that includes all relevant interventions, and presents their comparative effectiveness and potential for harm. Network meta-analysis provides an analysis option for such a review.
Any set of studies that links three or more interventions via direct comparisons forms a network of interventions. In a network of interventions there can be multiple ways to make indirect comparisons between the interventions. These are comparisons that have not been made directly within studies, and they can be estimated using mathematical combinations of the direct intervention effect estimates available. Network meta-analysis combines direct and indirect estimates across a network of interventions in a single analysis. Synonymous terms, less often used, are mixed treatment comparisons and multiple treatments meta-analysis.
11.1.1 Network diagrams
A network diagram is a graphical depiction of the structure of a network of interventions (Chaimani et al 2013). It consists of nodes representing the interventions in the network and lines showing the available direct comparisons between pairs of interventions. An example of a network diagram with four interventions is given in Figure 11.1.a. In this example, distinct lines forming a closed triangular loop have been added to illustrate the presence of a three-arm study. Note that for large and complex networks, such presentation of multi-arm studies may give complicated and unhelpful network diagrams; in this case it might be preferable to show multi-arm studies in a tabular format. Further discussion of displaying networks is available in Section 11.6.1.
Figure 11.1.a Example of network diagram with four competing interventions and information on the presence of multi-arm randomized trials

11.1.2 Advantages of network meta-analysis
A network meta-analysis exploits all available direct and indirect evidence. Empirical studies have suggested it yields more precise estimates of the intervention effects in comparison with a single direct or indirect estimate (Cooper et al 2011, Caldwell et al 2015). In addition, network meta-analysis can provide information for comparisons between pairs of interventions that have never been evaluated within individual randomized trials. The simultaneous comparison of all interventions of interest in the same analysis enables the estimation of their relative ranking for a given outcome (see Section 11.4.3.3 for more discussion of ranking).
11.1.3 Outline of this chapter
This chapter provides an overview of the concepts, assumptions and methods that relate to network meta-analyses and to the indirect intervention comparisons on which they are built. Section 11.2 first describes what an indirect comparison is and how it can be made in a simple trio of interventions. It then introduces the notion of transitivity (and its statistical analogue, coherence) as the core assumption underlying the validity of an indirect comparison. Examples are provided where this assumption is likely to hold or be violated.
Section 11.3 provides guidance on the design of a Cochrane Review with multiple interventions and the appropriate definition of the research question with respect to selecting studies, outcomes and interventions. Section 11.4 briefly describes the available statistical methods for synthesizing the data, estimating the relative ranking and assessing coherence in a network of interventions. Finally, Sections 11.5 and 11.6 provide approaches for evaluating confidence in the evidence and presenting the evidence base and the results from a network meta-analysis. Note that the chapter only introduces the statistical aspects of network meta-analysis; authors will need a knowledgeable statistician to plan and execute these methods.
11.2 Important concepts
At the heart of network meta-analysis methodology is the concept of an indirect comparison. Indirect comparisons are necessary to estimate the relative effect of two interventions when no studies have compared them directly.
11.2.1 Indirect comparisons
Indirect comparisons allow us to estimate the relative effects of two interventions that have not been compared directly within a trial. For example, suppose there are randomized trials directly comparing provision of dietary advice by a dietitian (which we refer to as intervention A) with advice given by a doctor (intervention B). Suppose there are also randomized trials comparing dietary advice given by a dietitian (intervention A) with advice given by a nurse (intervention C). Suppose further that these randomized trials have been combined in standard, pair-wise meta-analyses separately to derive direct estimates of intervention effects for A versus B (sometimes depicted ‘AB’) and A versus C (‘AC’), measured as mean difference (MD) in weight reduction (see Chapter 6, Section 6.5.1.1). The situation is illustrated in Figure 11.2.a, where the solid straight lines depict available evidence. We wish to learn about the relative effect of advice by a doctor versus a nurse (B versus C); the dashed line depicts this comparison, for which there is no direct evidence.
Figure 11.2.a Illustration of an indirect estimate that compares the effectiveness of ‘doctor’ (B) and ‘nurse’ (C) in providing dietary advice through a common comparator ‘dietitian’ (A)

One way to understand an indirect comparison is to think of the BC comparison (of B versus C) as representing the benefit of B over C. All else being equal, the benefit of B over C is equivalent to the benefit of B over A plus the benefit of A over C. Thus, for example, the indirect comparison describing benefit of ‘doctor’ over ‘nurse’ may be thought of as the benefit of ‘doctor’ over ‘dietitian’ plus the benefit of ‘dietitian’ over ‘nurse’ (these ‘benefits’ may be positive or negative; we do not intend to imply any particular superiority among these three types of people offering dietary advice). This is represented graphically in Figure 11.2.b.
Mathematically, the sum can be written:

We usually write this in the form of subtraction:

such that the difference between the summary statistics of the intervention effect in the direct A versus C and A versus B meta-analyses provides an indirect estimate of the B versus C intervention effect.
For this simple case where we have two direct comparisons (three interventions) the analysis can be conducted by performing subgroup analyses using standard meta-analysis routines (including RevMan): studies addressing the two direct comparisons (i.e. A versus B and A versus C) can be treated as two subgroups in the meta-analysis. The difference between the summary effects from the two subgroups gives an estimate for the indirect comparison.
Most software will provide a P value for the statistical significance of the difference between the subgroups based on the estimated variance of the indirect effect estimate (Bucher et al 1997):

where  and
and  are the variances of the respective direct estimates (from the two subgroup analyses).
A 95% confidence interval for the indirect summary effect is constructed by the formula:

This method uses the intervention effects from each group of randomized trials and therefore preserves within-trial randomization. If we had instead pooled single arms across the studies (e.g. all B arms and all C arms, ignoring the A arms) and then performed a direct comparison between the pooled B and C arms (i.e. treating the data as if they came from a single large randomized trial), then our analysis would discard the benefits of within-trial randomization (Li and Dickersin 2013). This approach should not be used.
Figure 11.2.b Graphical representation of the indirect comparison ‘doctor’ (B) versus ‘nurse’ (C) via ‘dietitian’ (A)

When four or more competing interventions are available, indirect estimates can be derived via multiple routes. The only requirement is that two interventions are ‘connected’ and not necessarily via a single common comparator. An example of this situation is provided in Figure 11.2.c. Here ‘doctor’ (B) and ‘pharmacist’ (D) do not have a common comparator, but we can compare them indirectly via the route ‘doctor’ (B) – ‘dietitian’ (A) – ‘nurse’ (C) – ‘pharmacist (D) by an extension of the arguments set out earlier.
Figure 11.2.c Example of deriving indirect estimate that compares the effectiveness of ‘doctor’ (B) and ‘pharmacist’ (D) in providing dietary advice through a connected loop

11.2.2 Transitivity
11.2.2.1 Validity of an indirect comparison
The underlying assumption of indirect comparisons is that we can learn about the true relative effect of B versus C via treatment A by combining the true relative effects A versus B and A versus C. This relationship can be written mathematically as

In words, this means that we can compare interventions B and C via intervention A (Figure 11.2.a).
Indirect comparisons provide observational evidence across randomized trials and may suffer the biases of observational studies, such as confounding (see Chapter 10, Section 10.11.5). The validity of an indirect comparison requires that the different sets of randomized trials are similar, on average, in all important factors other than the intervention comparison being made (Song et al 2003, Glenny et al 2005, Donegan et al 2010, Salanti 2012). We use the term transitivity to refer to this requirement. It is closely related to the statistical notion of coherence (see Section 11.2.3.2); the distinction is a little like that between diversity and (statistical) heterogeneity in pairwise meta-analysis (see Chapter 10, Section 10.10.1).
Studies that compare different interventions may differ in a wide range of characteristics. Sometimes these characteristics are associated with the effect of an intervention. We refer to such characteristics as effect modifiers; they are the aspects of diversity that induce heterogeneity in pairwise meta-analyses. If the A versus B and A versus C randomized trials differ with respect to their effect modifiers, then it would not be appropriate to make an indirect comparison.
Transitivity requires that intervention A is similar when it appears in A versus B studies and A versus C studies with respect to characteristics (effect modifiers) that may affect the two relative effects (Salanti et al 2009). For example, in the dietary advice network the common comparator ‘dietitian’ might differ with respect to the frequency of advice sessions between trials that compare dietitian with doctor (A versus B) and trials that compare dietitian with nurse (A versus C). If the participants visit the dietitian once a week in AB studies and once a month in AC studies, transitivity may be violated. Similarly, any other effect modifiers should not differ between AB and AC studies.
Transitivity requires all competing interventions of a systematic review to be jointly randomizable. That is, we can imagine all interventions being compared simultaneously in a single multi-arm randomized trial. Another way of viewing this is that, in any particular trial, the ‘missing’ interventions (those not included in trial) may be considered to be missing for reasons unrelated to their effects (Caldwell et al 2005, Salanti 2012).
11.2.2.2 Assessing transitivity
Clinical and methodological differences are inevitable between studies in a systematic review. Researchers undertaking indirect comparisons should assess whether such differences are sufficiently large to induce intransitivity. In principle, transitivity can be evaluated by comparing the distribution of effect modifiers across the different comparisons (Salanti 2012, Cipriani et al 2013, Jansen and Naci 2013). Imbalanced distributions would threaten the plausibility of the transitivity assumption and thus the validity of indirect comparison. In practice, however, this requires that the effect modifiers are known and have been measured. There are also some statistical options for assessing whether the transitive relationship holds in some circumstances, which we discuss in Section 11.4.4.
Extended guidance on considerations of potential effect modifiers is provided in discussions of heterogeneity in Chapter 10, Section 10.11. For example, we may believe that age is a potential effect modifier so that the effect of an intervention differs between younger and older populations. If the average age in A versus B randomized trials is substantially older or younger than in A versus C randomized trials, transitivity may be implausible, and an indirect comparison B versus C may be invalid.
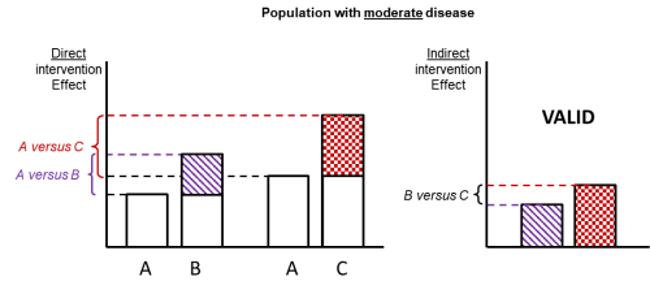
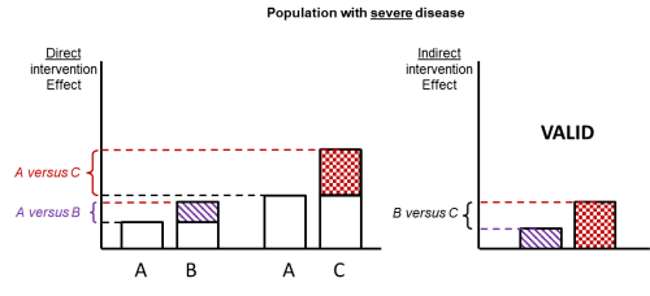
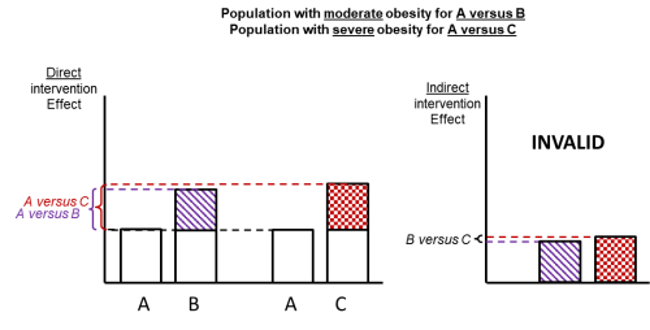
Figure 11.2.d shows hypothetical examples of valid and invalid indirect comparisons for the dietary advice example. Suppose a single effect modifier is severity of disease (e.g. obesity measured by the BMI score). The top row depicts a situation in which all patients in all trials have moderate severity. There are AB studies and AC studies in this population. Estimation of BC is valid here because there is no difference in the effect modifier. The second row depicts a similar situation in a second population of patients who all have severe disease. A valid indirect estimate of B versus C for this population can also be made. In the third row we depict a situation in which all AB trials are conducted only in moderately obese populations and all AC trials are conducted only in severely obese populations. In this situation, the distribution of effect modifiers is different in the two direct comparisons, so the indirect effect based on this row is invalid (due to intransitivity).
In practice, differences in effect modifiers are usually less extreme than this hypothetical scenario; for example, AB randomized trials may have 80% moderately obese population and 20% severely obese, and AC randomized trials may have 20% moderately obese and 80% severely obese population. Intransitivity would probably still invalidate the indirect estimate B versus C if severity is an important effect modifier.
Figure 11.2.d Example of valid and invalid indirect comparisons when the severity of disease acts as effect modifier and its distribution differs between the two direct comparisons. The shaded boxes represent the treatment effect estimates from each source of evidence (striped box for A versus B and checked box for A versus C). In the first row, randomized trials of A versus B and of A versus C are all conducted in moderately obese populations; in the second row randomized trials are all conducted in severely obese populations. In both of these the indirect comparisons of the treatment effect estimates would be valid. In the last row, the A versus B and A versus C randomized trials are conducted in different populations. As severity is an effect modifier, the indirect comparison based on these would not be valid (Jansen et al 2014). Reproduced with permission of Elsevier
11.2.3 Indirect comparisons and the validity of network meta-analysis
11.2.3.1 Combining direct and indirect evidence
Often there is direct evidence for a specific comparison of interventions as well as a possibility of making an indirect comparison of the interventions via one or more common comparators. If the key assumption of transitivity is considered reasonable, direct and indirect estimates should be considered jointly. When both direct and indirect intervention effects are available for a particular comparison, these can be synthesized into a single effect estimate. This summary effect is sometimes called a combined or mixed estimate of the intervention effect. We will use the former term in this chapter. A combined estimate can be computed as an inverse variance weighted average (see Chapter 10, Section 10.3) of the direct and indirect summary estimates.
Since combined estimates incorporate indirect comparisons, they rely on the transitivity assumption. Violation of transitivity threatens the validity of both indirect and combined estimates. Of course, biased direct intervention effects for any of the comparisons also challenge the validity of a combined effect (Madan et al 2011).
11.2.3.2 Coherence (or consistency)
The key assumption of transitivity relates to potential clinical and methodological variation across the different comparisons. These differences may be reflected in the data in the form of disagreement in estimates between different sources of evidence. The statistical manifestation of transitivity and is typically called either coherence or consistency. We will use the former to distinguish the notion from inconsistency (or heterogeneity) within standard meta-analyses (e.g. as is measured using the I2 statistic; see Chapter 10, Section 10.10.2). Coherence implies that the different sources of evidence (direct and indirect) agree with each other.
The coherence assumption is expressed mathematically by the coherence equations, which state that the true direct and indirect intervention effects for a specific comparison are identical:

Some methods for testing this assumption are presented in Section 11.4.4.
11.2.3.3 Validity of network meta-analysis
The validity of network meta-analysis relies on the fulfilment of underlying assumptions. Transitivity should hold for every possible indirect comparison, and coherence should hold in every loop of evidence within the network (see Section 11.4.4). Considerations about heterogeneity within each direct comparison in the network should follow the existing recommendations for standard pair-wise meta-analysis (see Chapter 10, Section 10.10).
11.3 Planning a Cochrane Review to compare multiple interventions
11.3.1 Expertise required in the review team
Because of the complexity of network meta-analysis, it is important to establish a multidisciplinary review team that includes a statistician skilled in network meta-analysis methodology early and throughout. Close collaboration between the statistician and the content area expert is essential to ensure that the studies selected for a network meta-analysis are similar except for the interventions being compared (see Section 11.2.2). Because basic meta-analysis software such as RevMan does not support network meta-analysis, the statistician will have to rely on statistical software packages such as Stata, R, WinBUGS or OpenBUGS for analysis.
11.3.2 The importance of a well-defined research question
Defining the research question of a systematic review that intends to compare multiple interventions should follow the general guidelines described in Chapter 2 and should be stated in the objectives of the review. In this section, we summarize and highlight key issues that are pertinent to systematic review with a network meta-analysis.
Because network meta-analysis could be used to estimate the relative ranking of the included interventions (Salanti et al 2011, Chaimani et al 2013), reviews that aim to rank the competing interventions should specify this in their objectives (Chaimani et al 2017). Review authors should consider obtaining an estimate of relative ranking as a secondary objective to supplement the relative effects. An extended discussion on the relative ranking of interventions is provided in Section 11.4.3.3.
11.3.2.1 Defining the population and choosing the interventions
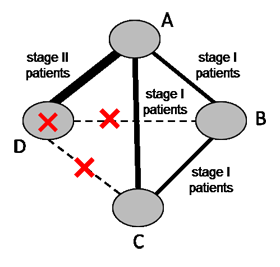
Populations and interventions often need to be considered together given the potential for intransitivity (see Section 11.2.2). A driving principle is that any eligible participant should be eligible for randomization to any included intervention (Salanti 2012, Jansen and Naci 2013). Review authors should select their target population with this consideration in mind. Particular care is needed in the definition of the eligible interventions, as discussed in Chaimani and colleagues (Chaimani et al 2017). For example, suppose a systematic review aims to compare four chemotherapy regimens for a specific cancer. Regimen (D) is appropriate for stage II patients exclusively and regimen (A) is appropriate for both stage I and stage II patients. The remaining two regimens (B) and (C) are appropriate for stage I patients exclusively. Now suppose A and D were compared in stage II patients, and A, B and C were compared in stage I patients (see Figure 11.3.a). The four interventions forming the network are unlikely to satisfy the transitivity assumption because regimen D is not given to the same patient population as regimens B and C. Thus, a four-arm randomized trial comparing all interventions (A, B, C and D) simultaneously is not a reasonable study to conduct.
Figure 11.3.a Example of a network comparing four chemotherapy regimens, where transitivity is violated due to incomparability between the interventions
11.3.2.2 Decision sets and supplementary sets of interventions
Usually there is a specific set of interventions of direct interest when planning a network meta-analysis, and these are sometimes referred to as the decision set. These are the options among which patients and health professionals would be choosing in practice with respect to the outcomes under investigation. In selecting which competing interventions to include in the decision set, review authors should ensure that the transitivity assumption is likely to hold (see also Section 11.2.2) (Salanti 2012).
The ability of network meta-analysis to incorporate indirect evidence means that inclusion of interventions that are not of direct interest to the review authors might provide additional information in the network. For example, placebo is often included in network meta-analysis even though it is not a reasonable treatment option, because many studies have compared active interventions against placebo. In such cases, excluding placebo would result in ignoring a considerable amount of indirect evidence. Similar considerations apply to historical or legacy interventions.
We use the term supplementary set to refer to interventions, such as placebo, that are included in the network meta-analysis for the purpose of improving inference among interventions in the decision set. The full set of interventions, the decision set plus the supplementary set, has been called in the literature the synthesis comparator set (Ades et al 2013, Caldwell et al 2015).
When review authors decide to include a supplementary set of interventions in a network, they need to be cautious regarding the plausibility of the transitivity assumption. In general, broadening the network challenges the transitivity assumption. Thus, supplementary interventions should be added when their value outweighs the risk of violating the transitivity assumption. The addition of supplementary interventions in the analysis might be considered more valuable for sparse networks that include only a few trials per comparison. In these networks the benefit of improving the precision of estimates by incorporating supplementary indirect evidence may be quite important. There is limited empirical evidence to inform the decision of how far one should go in constructing the network evidence base (König et al 2013, Caldwell et al 2015). Inevitably it will require some judgement, and the robustness of decisions can be evaluated in sensitivity analyses and discussed in the review.
11.3.2.3 Grouping variants of an intervention (defining nodes in the network diagram)
The definition of nodes needs careful consideration in situations where variants of one or more interventions are expected to appear in the eligible trials (James et al 2018). The appropriateness of merging, for example, different doses of the same drug or different drugs within a class depends to a large extent on the research question. Lumping and splitting the variants of the competing interventions might be interesting to both review authors and evidence users; in such a case this should be stated clearly in the objectives of the review and the potential for intransitivity should be evaluated in every network. A decision on how the nodes of an expanded network could be merged is not always straightforward and researchers should act based on predefined criteria where possible. These criteria should be formed in such a way that maximizes similarity of the interventions within a node and minimizes similarity across nodes.
The following example refers to a network that used two criteria to classify electronic interventions for smoking cessation into five categories: “To be able to draw generalizable conclusions on the different types of electronic interventions, we developed a categorization system that brought similar interventions together in a limited number of categories. We sought advice from experts in smoking cessation on the key dimensions that would influence the effectiveness of smoking cessation programmes. Through this process, two dimensions for evaluating interventions were identified. The first dimension was related to whether the intervention offered generic advice or tailored its feedback to information provided by the user in some way. The second dimension related to whether the intervention used a single channel or multiple channels. From these dimensions, we developed a system with five categories… , ranging from interventions that provide generic information through a single channel, e.g. a static Web site or mass e-mail (category e1) to complex interventions with multiple channels delivering tailored information, e.g. an interactive Web site plus an interactive forum (category e5)” (Madan et al 2014).
Empirical evidence is currently lacking on whether more or less expanded networks are more prone to important intransitivity or incoherence. Extended discussions of how different dosages can be modelled in network meta-analysis are available (Giovane et al 2013, Owen et al 2015, Mawdsley et al 2016).
11.3.2.4 Defining eligible comparisons of interventions (defining lines in the network diagram)
Once the nodes of the network have been specified, every study that meets the eligibility criteria and compares any pair of the eligible interventions should be included in the review. The exclusion of specific direct comparisons without a rationale may introduce bias in the analysis and should be avoided.
11.3.3 Selecting outcomes to examine
In the context of a network meta-analysis, outcomes should be specified a priori regardless of the number of interventions the review intends to compare or the number of studies the review is able to include. Review authors should be aware that some characteristics may be effect modifiers for some outcomes but not for other outcomes. This implies that sometimes the potential for intransitivity should be examined separately for each outcome before undertaking the analyses.
11.3.4 Study designs to include
Randomized designs are generally preferable to non-randomized designs to ensure an increased level of validity of the summary estimates (see Chapter 3). Sometimes observational data from non-randomized studies may form a useful source of evidence (see Chapter 24). In general, combining randomized with observational studies in a network meta-analysis is not recommended. In the case of sparse networks (i.e. networks with a few studies but many interventions), observational data might be used to supplement the analysis; for example, to form prior knowledge or provide information on baseline characteristics (Schmitz et al 2013, Soares et al 2014).
11.4 Synthesis of results
11.4.1 What does a network meta-analysis estimate?
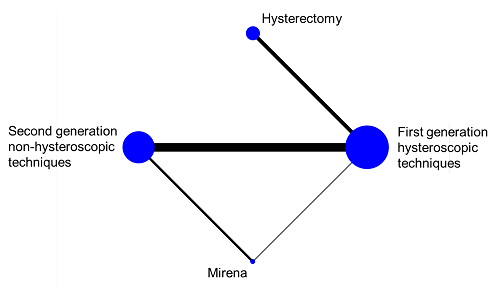
In a connected network, the coherence equations provide mathematical links between the intervention effects, so that some effects can be computed from others using transitivity assumptions. This means that not all pair-wise comparisons are independently estimated. In fact, the number of comparisons that need to be estimated in a network meta-analysis equals the number of interventions minus one. In practice, we select a particular set of comparisons of this size, and we often label these the basic comparisons for the analysis (Lu and Ades 2006). For example, in the network of four interventions for heavy menstrual bleeding illustrated in Figure 11.4.a we might choose the following three basic comparisons: ‘Hysterectomy versus first generation hysteroscopic techniques’, ‘Mirena versus first generation hysteroscopic techniques’ and ‘second generation non-hysteroscopic techniques versus first generation hysteroscopic techniques’. All other comparisons in the network (e.g. ‘Mirena versus hysterectomy’, ‘Mirena versus second generation non-hysteroscopic techniques’, etc.) can be computed from the three basic comparisons.
The main result of a network meta-analysis is a set of network estimates of the intervention effects for all basic comparisons. We obtain estimates for the other comparisons after the analysis using the coherence equations (see Section 11.2.3.2). It does not matter which set of comparisons we select as the basic comparisons. Often we would identify one intervention as a reference, and define the basic comparisons as the effect of each of the other interventions against this reference.
Figure 11.4.a Network graph of four interventions for heavy menstrual bleeding (Middleton et al 2010). The size of the nodes is proportional to the number of participants assigned to the intervention and the thickness of the lines is proportional to the number of randomized trials that studied the respective direct comparison. Reproduced with permission of BMJ Publishing Group
11.4.2 Synthesizing direct and indirect evidence using meta-regression
Network meta-analysis can be performed using several approaches (Salanti et al 2008). The main technical requirement for all approaches is that all interventions included in the analysis form a ‘connected’ network. A straightforward approach that be used for many networks is to use meta-regression (see Chapter 10, Section 10.11.4). This approach works as long as there are no multi-arm trials in the network (otherwise, other methods are more appropriate).
We introduced indirect comparisons in Section 11.2.1 in the context of subgroup analysis, where the subgroups are defined by the comparisons. Differences between subgroups of studies can also be investigated via meta-regression. When standard meta-regression is used to conduct a single indirect comparison, a single dummy variable is used to specify whether the result of each study relates to one direct comparison or the other (a dummy variable is coded as 1 or 0 to indicate which comparison is made in the study). For example, in the dietary advice network containing only three intervention nodes (see Section 11.2.1, Figure 11.2.a) the dummy variable might be used to indicate the comparison ‘dietitian versus nurse’. This variable takes the value 1 for a study that involves that corresponding comparison and 0 if it involves the comparison ‘dietitian versus doctor’, and is included as a single covariate in the meta-regression. In this way, the meta-regression model would have an intercept and a regression coefficient (slope). The estimated intercept gives the meta-analytic direct summary estimate for the comparison ‘dietitian versus doctor’ while the sum of the estimated regression coefficient and intercept gives the direct summary estimate for ‘dietitian versus nurse’. Consequently, the estimated coefficient is the indirect summary estimate for the comparison ‘doctor versus nurse’.
An alternative way to perform the same analysis of an indirect comparison is to re-parameterize the meta-regression model by using two dummy variables and no intercept, instead of one dummy variable and an intercept. The first dummy variable would indicate the comparison ‘dietitian versus doctor’, and the second the comparison ‘dietitian versus nurse’. The estimated regression coefficients then give the summary estimates for these two comparisons, and it is convenient to consider these as the two basic comparisons for this analysis. The difference between the two regression coefficients is the summary estimate for the indirect comparison ‘doctor versus nurse’.
The coding of each basic comparison using a dummy variable, and the omission of the intercept, proves to be a useful approach for implementing network meta-analysis using meta-regression, and helps explain the role of the coherence equations. Specifically, suppose now that in the dietary advice example, studies that directly compare ‘doctor versus nurse’ are also available. Because we are already estimating all of the basic comparisons required for three interventions, we do not require a third dummy variable (under coherence, the comparison ‘doctor versus nurse’ can be expressed as the difference between the other two comparisons: see Section 11.2.3.2). This means that studies comparing ‘doctor versus nurse’ inform us about the difference between the two comparisons already in the analysis. Consequently, we need to assign values −1 and 1 to the dummies ‘dietitian versus doctor’ and ‘dietitian versus nurse’, respectively. The meta-regression is again fitted including both dummy variables without an intercept. The interpretations of the estimated regression coefficients are the same as for the indirect comparison.
11.4.3 Performing network meta-analysis
We now consider approaches designed specifically for network meta-analysis that can be used when we have multi-arm trials. An overview of methodological developments can be found in Efthimiou and colleagues (Efthimiou et al 2016).
A popular approach to conducting network meta-analysis is using hierarchical models, commonly implemented within a Bayesian framework (Sobieraj et al 2013, Petropoulou et al 2016). Detailed descriptions of hierarchical models for network meta-analysis can be found elsewhere (Lu and Ades 2004, Salanti et al 2008, Dias et al 2018). Software options for a Bayesian approach include WinBUGS and OpenBUGS.
Multivariate meta-analysis methods, initially developed to synthesize multiple outcomes jointly (Jackson et al 2011, Mavridis and Salanti 2013), offer an alternative approach to conducting network meta-analysis. A multivariate meta-analysis approach focuses the analysis on the set of basic comparisons (e.g. each intervention against a common reference intervention) and treats these as analogous to different outcomes. A study can report on one or more of the basic comparisons; for example, there are two comparisons in a three-arm randomized trial. For studies that do not target any of the basic comparisons (e.g. a study that does not include the common reference intervention), a technique known as data augmentation can be used to allow the appropriate parameterization (White et al 2012). The method is implemented in the network macro available for Stata (White 2015). A detailed description of the concepts and the implementation of this approach is available (White et al 2012).
Methodology from electrical networks and graphic theory also can be used to fit network meta-analysis and is outlined in by Rücker (Rücker 2012). This approach has been implemented in the R package ‘netmeta’ (Rücker and Schwarzer 2013).
11.4.3.1 Illustrating example
To illustrate the advantages of network meta-analysis, Figure 11.4.a presents a network of four interventions for heavy menstrual bleeding (Middleton et al 2010). Data are available for four out of six possible direct comparisons. Table 11.4.a presents the results from direct (pair-wise) meta-analyses and a network meta-analysis using the meta-regression approach. Network meta-analysis provides evidence about the comparisons ‘Hysterectomy versus second generation non-hysteroscopic techniques’ and ‘Hysterectomy versus Mirena’, which no individual randomized trial has assessed. Also, the network meta-analysis results are more precise (narrower confidence intervals) than the pair-wise meta-analysis results for two comparisons (‘Mirena versus first generation hysteroscopic techniques’ and ‘Second generation non-hysteroscopic techniques versus Mirena’). Note that precision is not gained for all comparisons; this is because for some comparisons (e.g. ‘Hysterectomy versus first generation hysteroscopic techniques’), the heterogeneity among studies in the network as a whole is larger than the heterogeneity within the direct comparison, and therefore some uncertainty is added in the network estimates (see Section 11.4.3.2).
Table 11.4.a Intervention effects, measured as odds ratios of patient dissatisfaction at 12 months of four interventions for heavy menstrual bleeding. Odds ratios lower than 1 favour the column-defining intervention for the network meta-analysis results (lower triangle) and the row-defining intervention for the pair-wise meta-analysis results (upper triangle)
|
Pair-wise meta-analysis |
|||
|
Hysterectomy |
– |
– |
0.38 (0.22 to 0.65) |
|
0.45 (0.24 to 0.82) |
Second generation non-hysteroscopic techniques |
1.35 (0.45 to 4.08) |
0.82 (0.60 to 1.12) |
|
0.43 (0.18 to 1.06) |
0.96 (0.48 to 1.91) |
Mirena |
2.84 (0.51 to 15.87) |
|
0.38 (0.23 to 0.65) |
0.85 (0.63 to 1.15) |
0.88 (0.43 to 1.84) |
First generation hysteroscopic techniques |
|
Network meta-analysis |
|||
11.4.3.2 Assumptions about heterogeneity
Heterogeneity reflects the underlying differences between the randomized trials that directly compare the same pair of interventions (see Chapter 10, Section 10.10). In a pair-wise meta-analysis, the presence of important heterogeneity can make the interpretation of the summary effect challenging. Network meta-analysis estimates are a combination of the available direct estimates via both direct and indirect comparisons, so heterogeneity among studies for one comparison can impact on findings for many other comparisons.
It is important to specify assumptions about heterogeneity in the network meta-analysis model. Heterogeneity can be specific to each comparison, or assumed to the same for every pair-wise comparison. The idea is similar to a subgroup analysis: the different subgroups could have a common heterogeneity or different heterogeneities. The latter can be estimated accurately only if enough studies are available in each subgroup.
It is common to assume that the amount of heterogeneity is the same for every comparison in the network (Higgins and Whitehead 1996). This has three advantages compared with assuming comparison-specific heterogeneities. First, it shares information across comparisons, so that comparisons with only one or two trials can borrow information about heterogeneity from comparisons with several trials. Second, heterogeneity is estimated more precisely because more data contribute to the estimate, resulting usually in more precise estimates of intervention effects. Third, assuming common heterogeneity makes model estimation computationally easier than assuming comparison-specific heterogeneity (Lu and Ades 2009).
The choice of heterogeneity assumption should be based on clinical and methodological understanding of the data, and assessment of the plausibility of the assumption, in addition to statistical properties.
11.4.3.3 Ranking interventions
One hallmark feature of network meta-analysis is that it can estimate relative rankings of the competing interventions for a particular outcome. Ranking probability, the probability that an intervention is at a specific rank (first, second, etc.) when compared with the other interventions in the network, is frequently used. Ranking probabilities may vary for different outcomes. As for any estimated quantity, ranking probabilities are estimated with some variability. Therefore, inference based solely on the probability of being ranked as the best, without accounting for the variability, is misleading and should be avoided.
Ranking measures such as the mean ranks, median ranks and the cumulative ranking probabilities summarize the estimated probabilities for all possible ranks and account for uncertainty in relative ranking. Further discussion of ranking measures is available elsewhere (Salanti et al 2011, Chaimani et al 2013, Tan et al 2014, Rücker and Schwarzer 2015).
The estimated ranking probabilities for the heavy menstrual bleeding network (see Section 11.4.3.2) are presented in Table 11.4.b. ‘Hysterectomy’ is the most effective intervention according to mean rank.
Table 11.4.b Ranking probabilities and mean ranks for intervention effectiveness in heavy menstrual bleeding. Lower mean rank values indicate that the interventions are associated with less mortality
|
|
Rank |
Hysterectomy |
Second generation non-hysteroscopic techniques |
Mirena |
First generation hysteroscopic techniques |
|
|
Probabilities |
1 |
96% |
1% |
4% |
0% |
|
|
2 |
4% |
46% |
40% |
9% |
||
|
3 |
0% |
46% |
19% |
35% |
||
|
4 |
0% |
7% |
37% |
56% |
||
|
Mean rank |
1 |
3 |
3 |
4 |
||
11.4.4 Disagreement between evidence sources (incoherence)
11.4.4.1 What is incoherence?
Incoherence refers to the violation of the coherence assumption in a network of interventions (see Section 11.2.3.2). Incoherence occurs when different sources of information for a particular relative effect are in disagreement (Song et al 2003, Lu and Ades 2006, Salanti 2012). In much of the literature on network meta-analysis, the term inconsistency has been used, rather than incoherence.
The amount of incoherence in a closed loop of evidence in a network graph can be measured as the absolute difference between the direct and indirect summary estimates for any of the pair-wise comparisons in the loop (Bucher et al 1997, Song et al 2011, Veroniki et al 2013). We refer to this method of detecting incoherence as the ‘loop-specific approach’. The obtained statistic is usually called an incoherence factor or inconsistency factor (IF). For example, in the dietary advice network the incoherence factor would be estimated as:

IF measures the level of disagreement between the direct and indirect effect estimates.
The standard error of the incoherence factor is obtained from

and can be used to construct a 95% confidence interval for the IF:
Several approaches have been suggested for evaluating incoherence in a network of interventions with many loops (Donegan et al 2013, Veroniki et al 2013), broadly categorized as local and global approaches. Local approaches evaluate regions of network separately to detect possible ‘incoherence spots’, whereas global approaches evaluate coherence in the entire network.
11.4.4.2 Approaches to evaluating local incoherence
A recommended local approach for investigating incoherence is SIDE (Separating Indirect from Direct Evidence). This evaluates the IF for every pair-wise comparison in a network by contrasting a direct estimate (when available) with an indirect estimate; the latter being estimated from the entire network once the direct evidence has been removed. The method was first introduced by Dias and colleagues (Dias et al 2010) under the name ‘node-splitting’. The SIDE approach has been implemented in the network macro for Stata (White 2015) and the netmeta command in R (Schwarzer et al 2015). For example, Table 11.4.c presents the incoherence results of a network that compares the effectiveness of four active interventions and placebo in preventing serious vascular events after transient ischaemic attack or stroke (Thijs et al 2008). Data are available for seven out of ten possible direct comparisons and none of them was found to be statistically significant in terms of incoherence.
In the special case where direct and several independent indirect estimates are available, the ‘composite Chi2 statistic’ can be used instead (Caldwell et al 2010).
The loop-specific approach described in Section 11.4.4.1 can be extended to networks with many interventions by evaluating incoherence separately in each closed loop of evidence. The approach can be performed using the ifplot macro available for Stata (Chaimani and Salanti 2015). However, unlike the SIDE approach, this method does not incorporate the information from the entire network when estimating the indirect evidence.
Tests for incoherence have low power and therefore may fail to detect incoherence as statistically significant even when it is present (Song et al 2012, Veroniki et al 2014). This means that the absence of statistically significant incoherence is not evidence for the absence of incoherence. Review authors should consider the confidence intervals for incoherence factors and decide whether they include values that are sufficiently large to suggest clinically important discrepancies between direct and indirect evidence.
Table 11.4.c Results based on the SIDE approach to evaluating local incoherence. P values less than 0.05 suggest statistically significant incoherence
|
Comparison |
Direct |
Indirect |
Incoherence factor |
||||
|
Estimate |
Standard error |
Estimate |
Standard error |
Estimate |
Standard error |
P value |
|
|
A versus C |
–0.15 |
0.05 |
–0.21 |
0.10 |
0.07 |
0.12 |
0.56 |
|
A versus D |
–0.45 |
0.07 |
–0.32 |
0.11 |
–0.14 |
0.13 |
0.28 |
|
A versus E |
–0.26 |
0.14 |
–0.23 |
0.07 |
–0.03 |
0.16 |
0.85 |
|
B versus C |
0.18 |
0.11 |
0.13 |
0.08 |
0.05 |
0.14 |
0.70 |
|
B versus E |
0.07 |
0.07 |
0.12 |
0.12 |
–0.05 |
0.14 |
0.70 |
|
C versus D |
–0.23 |
0.06 |
–0.35 |
0.12 |
0.12 |
0.13 |
0.38 |
|
C versus E |
–0.06 |
0.05 |
–0.11 |
0.10 |
0.05 |
0.11 |
0.66 |
11.4.4.3 Approaches to evaluating global incoherence
Global incoherence in a network can be evaluated and detected via incoherence models. These models differ from the coherence models described in Section 11.4.3.1 by relaxing the coherence equations (see Section 11.2.3.2) and allowing intervention effects to vary when estimated directly and indirectly (Lu and Ades 2006). The models add additional terms, equivalent to the incoherence factors (IFs) defined in Section 11.4.4.1, to the coherence equations. For example, in the dietary advice network the coherence equation given in Section 11.2.3.2 would be modified to:

The quantity IFABC measures incoherence in the evidence loop ‘dietitian-doctor-nurse’. Obviously, complex networks will have several IFs. For a network to be coherent, all IF need to be close to zero. This can be formally tested via a Chi2 statistic test which is available in Stata in the network macro (White 2015). An extension of this model has been suggested where incoherence measures the disagreement when an effect size is measured in studies that involve different sets of interventions (termed ‘design incoherence’) (Higgins et al 2012).
Measures like the Q-test and the I2 statistic, which are commonly used for the evaluation of heterogeneity in a pair-wise meta-analysis (see Chapter 10, Section 10.10.2), have been developed for the assessment of heterogeneity and incoherence in network meta-analysis (Krahn et al 2013, Rücker and Schwarzer 2013, Jackson et al 2014). These have been implemented in the package netmeta in R (Schwarzer et al 2015).
11.4.4.4 Forming conclusions about incoherence
We suggest review authors use both local and global approaches and consider their results jointly to make inferences about incoherence. The approaches presented in Sections 11.4.4.2 and 11.4.4.3 for evaluating incoherence have limitations. As for tests for statistical heterogeneity in a standard pair-wise meta-analysis, tests for detecting incoherence often lack power to detect incoherence when it is present, as shown in simulations and empirical studies (Song et al 2012, Veroniki et al 2014). Also, different assumptions and different methods in the estimation of heterogeneity may have an impact on the findings about incoherence (Veroniki et al 2013, Veroniki et al 2014). Empirical evidence suggests that review authors sometimes assess the presence of incoherence, if at all, using inappropriate methods (Veroniki et al 2013, Nikolakopoulou et al 2014, Petropoulou et al 2016).
Conclusions should be drawn not just from consideration of statistical significance but by interpreting the range of values included in confidence intervals of the incoherence factors. Researchers should remember that the absence of statistically significant incoherence does not ensure transitivity in the network, which should always be assessed by examining effect modifiers before undertaking the analysis (see Section 11.2.2.2).
Once incoherence is detected, possible explanations should be sought. Errors in data collection, broad eligibility criteria and imbalanced distributions of effect modifiers may have introduced incoherence. Possible analytical strategies in the presence of incoherence are available (Salanti 2012, Jansen and Naci 2013).
11.5 Evaluating confidence in the results of a network meta-analysis
The GRADE approach is recommended for use in Cochrane Reviews to assess the confidence of the evidence for each pair-wise comparison of interventions (see Chapter 14). The approach starts by assuming high confidence in the evidence for randomized trials of a specific pair-wise comparison and then rates down the evidence for considerations of five issues: study limitations, indirectness, inconsistency, imprecision and publication bias.
Rating the confidence in the evidence from a network of interventions is more challenging than pair-wise meta-analysis (Dumville et al 2012). To date, two frameworks have been suggested in the literature to extend the GRADE system to indirect comparisons and network meta-analyses: Salanti and colleagues (Salanti et al 2014) and Puhan and colleagues (Puhan et al 2014). Section 11.5.1 describes the principles of each approach, noting similarities and differences.
11.5.1 Available approaches for evaluating confidence in the evidence
The two available approaches to evaluating confidence in evidence from a network meta-analysis acknowledge that the confidence in each combined comparison depends on the confidence in the direct and indirect comparisons that contribute to it, and that the confidence in each indirect comparison in turn depends on the confidence in the pieces of direct evidence that contribute to it. Therefore, all GRADE assessments are built to some extent on applying GRADE ideas for direct evidence. The two approaches diverge in the way they combine the considerations when thinking about an indirect or combined comparison, as illustrated in Table 11.5.a using the dietary advice example.
The framework by Salanti and colleagues is driven by the ability to express each estimated intervention effect from a network meta-analysis as a weighted sum of all the available direct comparisons (see Section 11.4) (Lu et al 2011, König et al 2013, Krahn et al 2013). The weight is determined, under some assumptions, by the contribution matrix, which has been implemented in the netweight macro (Chaimani and Salanti 2015) available for the Stata statistical package and programmed in an online tool – CINeMA – which assesses ‘Confidence in Network Meta-Analysis’ (https://cinema.ispm.unibe.ch/). The matrix contains the percentage of information attributable to each direct comparison estimate and can be interpreted as the contributions of the direct comparison estimates. Then, the confidence in an indirect or combined comparison is estimated by combining the confidence assessment for the available direct comparison estimates with their contribution to the combined (or network) comparison. This approach is similar to the process of evaluating the likely impact of a high risk-of-bias study by looking at its weight in a pair-wise meta-analysis to decide whether to downgrade or not in a standard GRADE assessment.
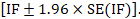
As an example, in the dietary advice network (Figure 11.2.a) suppose that most of the evidence involved in the indirect comparison (i.e. the trials including dietitians) is at low risk of bias, and that there are studies of ‘doctor versus nurse’ that are mostly at high risk of bias. If the direct evidence on ‘doctor versus nurse’ has a very large contribution to the network meta-analysis estimate of the same comparison, then we would judge this result to be at high risk of bias. If the direct evidence has a very low contribution, we might judge the result to be at moderate, or possibly low, risk of bias. This approach might be preferable when there are indirect or mixed comparisons informed by many loops within a network, and for a specific comparison these loops lead to different risk-of-bias assessments. The contributions of the direct comparisons and the risk-of-bias assessments may be presented jointly in a bar graph, with bars proportional to the contributions of direct comparisons and different colours representing the different judgements. The bar graph for the heavy menstrual bleeding example is available in Figure 11.5.a, which suggests that there are two comparisons (‘First generation hysteroscopic techniques versus Mirena’ and ‘Second generation non-hysteroscopic techniques versus Mirena’) for which a substantial amount of information comes from studies at high risk of bias.
Regardless of whether a review contains a network meta-analysis or a simple indirect comparison, Puhan and colleagues propose to focus on so-called ‘most influential’ loops only. These are the connections between a pair of interventions of interest that involve exactly one common comparator. This implies that the assessment for the indirect comparison is dependent only on confidence in the two other direct comparisons in this loop. To illustrate, consider the dietary advice network described in Section 11.2 (Figure 11.2.a), where we are interested in confidence in the evidence for the indirect comparison ‘doctor versus nurse’. According to Puhan and colleagues, the lower confidence rating between the two direct comparisons ‘dietitian versus doctor’ and ‘dietitian versus nurse’ would be chosen to inform the confidence rating for the indirect comparison. If there are also studies directly comparing doctor versus nurse, the confidence in the combined comparison would be the higher rated source between the direct evidence and the indirect evidence. The main rationale for this is that, in general, the higher rated comparison is expected to be the more precise (and thus the dominating) body of evidence. Also, in the absence of important incoherence, the lower rated evidence is only supportive of the higher rated evidence; thus it is not very likely to reduce the confidence in the estimated intervention effects. One disadvantage of this approach is that investigators need to identify the most influential loop; this loop might be relatively uninfluential when there are many loops in a network, which is often the case when there are many interventions. In large networks, many loops with comparable influence may exist and it is not clear how many of those equally influential loops should be considered under this approach.
At the time of writing, no formal comparison has been performed to evaluate the degree of agreement between these two methods. Thus, at this point we do not prescribe using one approach or the other. However, when indirect comparisons are built on existing pair-wise meta-analyses, which have already been rated with respect to their confidence, it may be reasonable to follow the approach of Puhan and colleagues. On the other hand, when the body of evidence is built from scratch, or when a large number of interventions are involved, it may be preferable to consider the approach of Salanti and colleagues whose application is facilitated via the online tool CINeMA.
Since network meta-analysis produces estimates for several intervention effects, the confidence in the evidence should be assessed for each intervention effect that is reported in the results. In addition, network meta-analysis may also provide information on the relative ranking of interventions, and review authors should consider also assessing confidence in results for relative ranking when these are reported. Salanti and colleagues address confidence in the ranking based on the contributions of the direct comparisons to the entire network as well as on the use of measures and graphs that aim to assess the different GRADE domains in the network as a whole (e.g. measures of global incoherence) (see Section 11.4.4).
The two approaches modify the standard GRADE domains to fit network meta-analysis to varying degrees. These modifications are briefly described in Box 11.5.a; more details and examples are available in the original articles (Puhan et al 2014, Salanti et al 2014).
Table 11.5.a Steps to obtain the overall confidence ratings (across all GRADE domains) for every combined comparison of the dietary advice example. A ✓ or x indicates whether a particular step is needed in order to proceed to the next step
|
Direct comparisons |
GRADE domains |
Step 1 |
Step 2 |
Step 3 |
|||||
|
Domain-specific ratings for direct comparisons |
Overall rating across domains for direct comparisons |
Domain-specific ratings for combined comparisons |
Overall rating across domains for combined comparisons |
||||||
|
Salanti et al |
Puhan et al |
Salanti et al |
Puhan et al |
Salanti et al |
Puhan et al |
Salanti et al |
Puhan et al |
||
|
Dietitian versus nurse |
Study limitations |
✓ |
✓ |
x |
✓ |
✓ |
x |
✓ |
✓ |
|
Indirectness |
✓ |
✓ |
✓ |
x |
|||||
|
Inconsistency |
✓ |
✓ |
✓ |
x |
|||||
|
Imprecision |
- |
- |
✓ |
x |
|||||
|
Publication bias |
✓ |
✓ |
✓ |
x |
|||||
|
Dietitian versus doctor |
Study limitations |
✓ |
✓ |
x |
✓ |
✓ |
x |
✓ |
✓ |
|
Indirectness |
✓ |
✓ |
✓ |
x |
|||||
|
Inconsistency |
✓ |
✓ |
✓ |
x |
|||||
|
Imprecision |
- |
- |
✓ |
x |
|||||
|
Publication bias |
✓ |
✓ |
✓ |
x |
|||||
|
Nurse versus doctor |
Study limitations |
✓ |
✓ |
x |
✓ |
✓ |
x |
✓ |
✓ |
|
Indirectness |
✓ |
✓ |
✓ |
x |
|||||
|
Inconsistency |
✓ |
✓ |
✓ |
x |
|||||
|
Imprecision |
- |
- |
✓ |
x |
|||||
|
Publication bias |
✓ |
✓ |
✓ |
x |
|||||
Figure 11.5.a Bar graph illustrating the percentage of information for every comparison that comes from low (dark grey), moderate (light grey) or high (black) risk-of-bias (RoB) studies with respect to both randomization and compliance to treatment for the heavy menstrual bleeding network (Middleton et al 2010). The risk of bias of the direct comparisons was defined based on Appendix 3 of the original paper. The intervention labels are: A, first generation hysteroscopic techniques; B, hysterectomy; C, second generation non-hysteroscopic techniques; D, Mirena. Reproduced with permission of BMJ Publishing Group
Box 11.5.a Modifications to the five domains of the standard GRADE system to fit network meta-analysis
|
Study limitations (i.e. classical risk-of-bias items) Salanti and colleagues suggest a bar graph with bars proportional to the contributions of direct comparisons and different colours representing the different confidence ratings (e.g. green, yellow, red for low, moderate or high risk of bias) with respect to study limitations (Figure 11.5.a). The decision about downgrading or not is then formed by interpreting this graph. Such a graph can be used to rate the confidence of evidence for each combined comparison and for the relative ranking.
Indirectness The assessment of indirectness in the context of network meta-analysis should consider two components: the similarity of the studies in the analysis to the target question (PICO); and the similarity of the studies in the analysis to each other. The first addresses the extent to which the evidence at hand relates to the population, intervention(s), comparators and outcomes of interest, and the second relates to the evaluation of the transitivity assumption. A common view of the two approaches is that they do not support the idea of downgrading indirect evidence by default. They suggest that indirectness should be considered in conjunction with the risk of intransitivity.
Inconsistency Salanti and colleagues propose to create a common domain to consider jointly both types of inconsistency that may occur: heterogeneity within direct comparisons and incoherence. More specifically, they evaluate separately the presence of the two types of variation and then consider them jointly to infer whether downgrading for inconsistency is appropriate or not. It is usual in network meta-analysis to assume a common heterogeneity variance. They propose the use of prediction intervals to facilitate the assessment of heterogeneity for each combined comparison. Prediction intervals are the intervals expected to include the true intervention effects in future studies (Higgins et al 2009, Riley et al 2011) and they incorporate the extent of between-study variation; in the presence of important heterogeneity they are wide enough to include intervention effects with different implications for practice. The potential for incoherence for a particular comparison can be assessed using existing approaches for evaluating local and global incoherence (see Section 11.5). We may downgrade for one or two levels due to the presence of heterogeneity or incoherence, or both. The judgement for the relative ranking is based on the magnitude of the common heterogeneity as well as the use of global incoherence tests (see Section 11.4).
Imprecision Both approaches suggest that imprecision of the combined comparisons can be judged based on their 95% confidence intervals. Imprecision for relative treatment ranking is the variability in the relative order of the interventions. This is reflected by the overlap in the distributions of the ranking probabilities; i.e. when all or some of the interventions have similar probabilities of being at a particular rank. Publication bias The potential for publication bias in a network meta-analysis can be difficult to judge. If a natural common comparator exists, a ‘comparison-adjusted funnel plot’ can be employed to identify possible small-study effects in a network meta-analysis (Chaimani and Salanti 2012, Chaimani et al 2013). This is a modified funnel plot that allows putting together all the studies of the network irrespective of the interventions they compare. However, the primary considerations for both the combined comparisons and relative ranking should be non-statistical. Review authors should consider whether there might be unpublished studies for every possible pairwise comparison in the network. |
11.6 Presenting network meta-analyses
The PRISMA Extension Statement for Reporting of Systematic Reviews Incorporating Network Meta-analyses of Health Care Interventions should be considered when reporting the results from network meta-analysis (Hutton et al 2015). Key graphical and numerical summaries include the network plot (e.g. Figure 11.4.a), a league table of the relative effects between all treatments with associated uncertainty (e.g. Table 11.4.a) and measures of heterogeneity and incoherence.
11.6.1 Presenting the evidence base of a network meta-analysis
Network diagrams provide a convenient way to describe the structure of the network (see Section 11.1.1). They may be modified to incorporate information on study-level or comparison-level characteristics. For instance, the thickness of the lines might reflect the number of studies or patients included in each direct comparison (e.g. Figure 11.4.a), or the comparison-specific average of a potential effect modifier. Using the latter device, network diagrams can be considered as a first step for the evaluation of transitivity in a network. In the example of Figure 11.6.a the age of the participants has been considered as a potential effect modifier. The thickness of the line implies that the average age within comparisons A versus D and C versus D seems quite different to the other three direct comparisons.
The inclusion of studies with design limitations in a network (e.g. lack of blinding, inadequate allocation sequence concealment) often threatens the validity of findings. The use of coloured lines in a network of interventions can reveal the presence of such studies in specific direct comparisons. Further discussion on issues related to confidence in the evidence is available in Section 11.5.
Figure 11.6.a Example of network diagram with lines weighted according to the average age within each pair-wise comparison. Thicker lines correspond to greater average age within the respective comparison

11.6.2 Tabular presentation of the network structure
For networks including many competing interventions and multiple different study designs, network diagrams might not be the most appropriate tool for presenting the data. An alternative way to present the structure of the network is to use a table, in which the columns represent the competing interventions and the rows represent the different study designs in terms of interventions being compared (Table 11.6.a) (Lu and Ades 2006). Additional information, such as the number of participants in each arm, may be presented in the non-empty cells.
Table 11.6.a Example of table presenting a network that compares seven interventions and placebo for controlling exacerbation of episodes in chronic obstructive pulmonary disease (Baker et al 2009). Reproduced with permission of John Wiley & Sons
|
Number of studies |
Placebo |
Fluticasone |
Budesonide |
Salmeterol |
Formoterol |
Tiotropium |
Fluticasone + salmeterol |
Budesonide + formoterol |
|
4 |
x |
x |
x |
x |
||||
|
4 |
x |
x |
||||||
|
2 |
x |
x |
x |
x |
||||
|
2 |
x |
x |
x |
|||||
|
2 |
x |
x |
x |
|||||
|
8 |
x |
x |
||||||
|
2 |
x |
x |
||||||
|
10 |
x |
x |
||||||
|
1 |
x |
x |
||||||
|
1 |
x |
x |
||||||
|
1 |
x |
x |
||||||
|
1 |
x |
x |
||||||
|
1 |
x |
x |
11.6.3 Presenting the flow of evidence in a network
Another way to map the evidence in a network of interventions is to consider how much each of the included direct comparisons contributes to the final combined effect estimates. The percentage information that direct evidence contributes to each relative effect estimated in a network meta-analysis can be presented in the contribution matrix (see Section 11.4), and could help investigators understand the flow of information in the network (Chaimani et al 2013, Chaimani and Salanti 2015).
Figure 11.6.b presents the contribution matrix for the example of the network of interventions for heavy menstrual bleeding (obtained from the netweight macro in Stata). The indirect treatment effect for second generation non-hysteroscopic techniques versus hysterectomy (B versus C) can be estimated using information from the four direct relative treatment effects; these contribute information in different proportions depending on the precision of the direct treatment effects and the structure of the network. Evidence from the direct comparison of first generation hysteroscopic techniques versus hysterectomy (A versus B) has the largest contribution to the indirect comparisons hysterectomy versus second generation non-hysteroscopic techniques (B versus C) (49.6%) and hysterectomy versus Mirena (B versus D) (38.5%), for both of which no direct evidence exists.
Figure 11.6.b Contribution matrix for the network on interventions for heavy menstrual bleeding presented in Figure 11.4.a. Four direct comparisons in the network are presented in the columns, and their contributions to the combined treatment effect are presented in the rows. The entries of the matrix are the percentage weights attributed to each direct comparison. The intervention labels are: A, first generation hysteroscopic techniques; B, hysterectomy; C, second generation non-hysteroscopic techniques; D, Mirena

11.6.4 Presentation of results
Unlike pair-wise meta-analysis, the results from network meta-analysis cannot be easily summarized in a single figure such as a standard forest plot. Especially for networks with many competing interventions that involve many comparisons, presentation of findings in a concise and comprehensible way is challenging.
Summary statistics of the intervention effects for all pairs of interventions are the most important output from network meta-analysis. Results from a subset of comparisons are sometimes presented due to space limitations and the choice of the findings to be reported is based on the research question and the target audience (Tan et al 2013). In such cases, the use of additional figures and tables to present all results in detail is necessary. Additionally, review authors might wish to report the relative ranking of interventions (see Section 11.4.3.3) as a supplementary output, which provides a concise summary of the findings and might facilitate decision making. For this purpose, joint presentation of both relative effects and relative ranking is recommended (see Figure 11.6.c or Table 11.4.a of Section 11.4.3.1).
In the presence of many competing interventions, the results across different outcomes (e.g. efficacy and acceptability) might conflict with respect to which interventions work best. To avoid drawing misleading conclusions, review authors may consider the simultaneous presentation of results for outcomes in these two categories.
Interpretation of the findings from network meta-analysis should always be considered with the evidence characteristics: risk of bias in included studies, heterogeneity, incoherence and selection bias. Reporting results with respect to the evaluation of incoherence and heterogeneity (such as I2 statistic for incoherence) is important for drawing meaningful conclusions.
11.6.4.1 Presentation of intervention effects and ranking
A table presenting direct, indirect and network summary relative effects along with their confidence ratings is a helpful format (Puhan et al 2014). In addition, various graphical tools have been suggested for the presentation of results from network meta-analyses (Salanti et al 2011, Chaimani et al 2013, Tan et al 2014). Summary relative effects for pair-wise comparisons with their confidence intervals can be presented in a forest plot. For example, Figure 11.6.c shows the summary relative effects for each intervention versus a common reference intervention for the ‘heavy menstrual bleeding’ network.
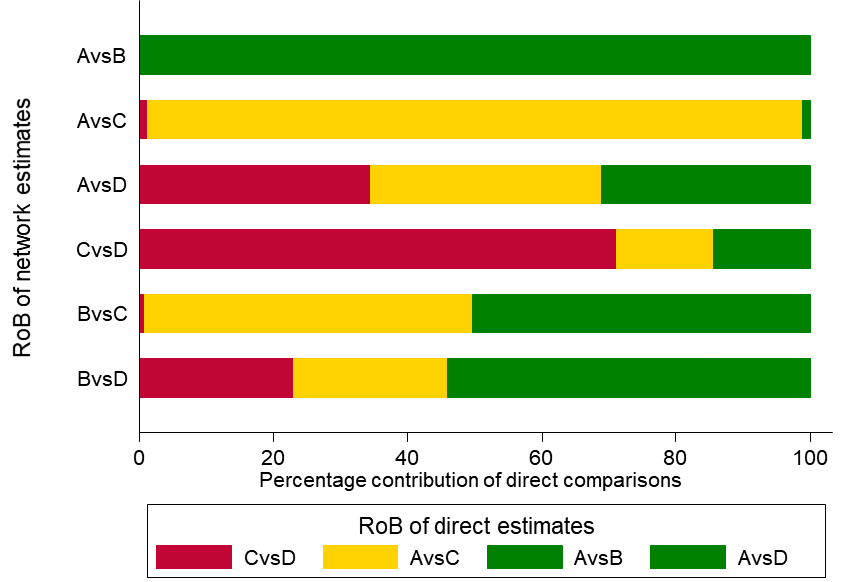
Ranking probabilities for all possible ranks may be presented by drawing probability lines, which are known as rankograms, and show the distribution of ranking probabilities for each intervention (Salanti et al 2011). The rankograms for the heavy menstrual bleeding network example are shown in Figure 11.6.d. The graph suggests that ‘Hysterectomy’ has the highest probability of being the best intervention, ‘First generation hysteroscopic techniques’ have the highest probability of being worst followed by ‘Mirena’ and ‘Second generation non-hysteroscopic techniques’ have equal chances of being second or third.
The relative ranking for two (competing) outcomes can be presented jointly in a two-dimensional scatterplot (Chaimani et al 2013). An extended discussion on different ways to present jointly relative effects and relative ranking from network meta-analysis is available in Tan and colleagues (Tan et al 2013).
Figure 11.6.c Forest plot for effectiveness in heavy menstrual bleeding between four interventions. FGHT, first generation hysteroscopic techniques; SGNHT, second generation non-hysteroscopic techniques

Figure 11.6.d Ranking probabilities (rankograms) for the effectiveness of interventions in heavy menstrual bleeding. The horizontal axis shows the possible ranks and the vertical axis the ranking probabilities. Each line connects the estimated probabilities of being at a particular rank for every intervention
11.6.4.2 Presentation of heterogeneity and incoherence
The level of heterogeneity in a network of interventions can be expressed via the magnitude of the between-study variance Tau2, typically assumed to be common in all comparisons in the network. A judgement on whether the estimated Tau2 suggests the presence of important heterogeneity depends on the clinical outcome and the type of interventions being compared. More extended discussion on the expected values of Tau2 specific to a certain clinical setting is available (Turner et al 2012, Nikolakopoulou et al 2014).
Forest plots that present all the estimated incoherence factors in the network and their uncertainty may be employed for the presentation of local incoherence (Salanti et al 2009, Chaimani et al 2013). The results from evaluating global incoherence can be summarized in the P value of the Chi2 statistic incoherence test and the I2 statistic for incoherence (see Chapter 10, Section 10.10.2).
11.6.4.3 ‘Summary of findings’ tables
The purpose of ‘Summary of findings’ tables in Cochrane Reviews is to provide concisely the key information in terms of available data, confidence in the evidence and intervention effects (see Chapter 14). Providing such a table is more challenging in reviews that compare multiple interventions simultaneously, which very often involve a large number of comparisons between pairs of interventions. A general principle is that the comparison of multiple interventions is the main feature of a network meta-analysis, so is likely to drive the structure of the ‘Summary of findings’ table. This is in contrast to the ‘Summary of findings’ table for a pair-wise comparison, whose main strength is to facilitate comparison of effects on different outcomes. Nevertheless, it remains important to be able to compare network meta-analysis results across different outcomes. This provides presentational challenges that are almost impossible to resolve in two dimensions. One potential solution is an interactive electronic display such that the user can choose whether to emphasize the comparisons across interventions or the comparisons across outcomes.
For small networks of interventions (perhaps including up to five competing interventions) a separate ‘Summary of findings’ table might be produced for each main outcome. However, in the presence of many (more than five) competing interventions, researchers would typically need to select and report a reduced number of pair-wise comparisons. Review authors should provide a clear rationale for the choice of the comparisons they report in the ‘Summary of findings’ tables. For example, they may consider including only pair-wise comparisons that correspond to the decision set of interventions; that is, the group of interventions of direct interest for drawing conclusions (see Section 11.3.2.1). The distinction between the decision set and the wider synthesis comparator set (all interventions included in the analysis) should be made in the protocol of the review. If the decision set is still too large, researchers may be able to select the comparisons for the ‘Summary of findings’ table based on the most important information for clinical practice. For example, reporting the comparisons between the three or four most effective interventions with the most commonly used intervention as a comparator.
11.7 Concluding remarks
Network meta-analysis is a method that can inform comparative effectiveness of multiple interventions, but care needs to be taken using this method because it is more statistically complex than a standard meta-analysis. In addition, as network meta-analyses generally ask broader research questions, they usually involve more studies at each step of systematic review, from screening to analysis, than standard meta-analysis. It is therefore important to anticipate the expertise, time and resource required before embarking on one.
A valid indirect comparison and network meta-analysis requires a coherent evidence base. When formulating the research question and deciding the eligibility criteria, populations and interventions in relation to the assumption of transitivity need to be considered. Network meta-analysis is only valid when studies comparing different sets of interventions are similar enough to be combined. When conducted properly, it provides more precise estimates of relative effect than a single direct or indirect estimate. Network meta-analysis can yield estimates between any pairs of interventions, including those that have never been compared directly against each other. Network meta-analysis also allows the estimation of the ranking and hierarchy of interventions. Much care should be taken when interpreting the results and drawing conclusions from network meta-analysis, especially in the presence of incoherence or other potential biases.
11.8 Chapter information
Authors: Anna Chaimani, Deborah M Caldwell, Tianjing Li, Julian PT Higgins, Georgia Salanti
Acknowledgements: Lorne Becker contributed important insights in the discussion of separating Overview from Intervention Reviews with network meta-analysis. Gordon Guyatt provided helpful comments on earlier version of the chapter and Jeroen Jansen provided helpful contributions on Section 11.2.
Funding: This work was supported by the Methods Innovation Fund Program of the Cochrane Collaboration (MIF1) under the project ‘Methods for comparing multiple interventions in Intervention reviews and Overviews of reviews’.
11.9 References
Ades AE, Caldwell DM, Reken S, Welton NJ, Sutton AJ, Dias S. Evidence synthesis for decision making 7: a reviewer’s checklist. Medical Decision Making 2013; 33: 679–691.
Baker WL, Baker EL, Coleman CI. Pharmacologic treatments for chronic obstructive pulmonary disease: a mixed-treatment comparison meta-analysis. Pharmacotherapy 2009; 29: 891–905.
Bucher HC, Guyatt GH, Griffith LE, Walter SD. The results of direct and indirect treatment comparisons in meta-analysis of randomized controlled trials. Journal of Clinical Epidemiology 1997; 50: 683–691.
Caldwell DM, Ades AE, Higgins JPT. Simultaneous comparison of multiple treatments: combining direct and indirect evidence. BMJ 2005; 331: 897–900.
Caldwell DM, Welton NJ, Ades AE. Mixed treatment comparison analysis provides internally coherent treatment effect estimates based on overviews of reviews and can reveal inconsistency. Journal of Clinical Epidemiology 2010; 63: 875–882.
Caldwell DM, Dias S, Welton NJ. Extending treatment networks in health technology assessment: how far should we go? Value in Health 2015; 18: 673–681.
Chaimani A, Salanti G. Using network meta-analysis to evaluate the existence of small-study effects in a network of interventions. Research Synthesis Methods 2012; 3: 161–176.
Chaimani A, Higgins JPT, Mavridis D, Spyridonos P, Salanti G. Graphical tools for network meta-analysis in STATA. PloS One 2013; 8: e76654.
Chaimani A, Salanti G. Visualizing assumptions and results in network meta-analysis: the network graphs package. Stata Journal 2015; 15: 905–950.
Chaimani A, Caldwell DM, Li T, Higgins JPT, Salanti G. Additional considerations are required when preparing a protocol for a systematic review with multiple interventions. Journal of Clinical Epidemiology 2017; 83: 65–74.
Cipriani A, Higgins JPT, Geddes JR, Salanti G. Conceptual and technical challenges in network meta-analysis. Annals of Internal Medicine 2013; 159: 130–137.
Cooper NJ, Peters J, Lai MC, Jüni P, Wandel S, Palmer S, Paulden M, Conti S, Welton NJ, Abrams KR, Bujkiewicz S, Spiegelhalter D, Sutton AJ. How valuable are multiple treatment comparison methods in evidence-based health-care evaluation? Value in Health 2011; 14: 371–380.
Dias S, Welton NJ, Caldwell DM, Ades AE. Checking consistency in mixed treatment comparison meta-analysis. Statistics in Medicine 2010; 29: 932–944.
Dias S, Ades AE, Welton NJ, Jansen JP, Sutton AJ. Network meta-analysis for decision-making. Chichester (UK): Wiley; 2018.
Donegan S, Williamson P, Gamble C, Tudur-Smith C. Indirect comparisons: a review of reporting and methodological quality. PloS One 2010; 5: e11054.
Donegan S, Williamson P, D’Alessandro U, Tudur Smith C. Assessing key assumptions of network meta-analysis: a review of methods. Research Synthesis Methods 2013; 4: 291–323.
Dumville JC, Soares MO, O’Meara S, Cullum N. Systematic review and mixed treatment comparison: dressings to heal diabetic foot ulcers. Diabetologia 2012; 55: 1902–1910.
Efthimiou O, Debray TPA, Valkenhoef G, Trelle S, Panayidou K, Moons KGM, Reitsma JB, Shang A, Salanti G, GetReal Methods Review Group. GetReal in network meta-analysis: a review of the methodology. Research Synthesis Methods 2016; 7: 236–263.
Giovane CD, Vacchi L, Mavridis D, Filippini G, Salanti G. Network meta-analysis models to account for variability in treatment definitions: application to dose effects. Statistics in Medicine 2013; 32: 25–39.
Glenny AM, Altman DG, Song F, Sakarovitch C, Deeks JJ, D’Amico R, Bradburn M, Eastwood AJ. Indirect comparisons of competing interventions. Health Technology Assessment 2005; 9: 1–iv.
Higgins JPT, Whitehead A. Borrowing strength from external trials in a meta-analysis. Statistics in Medicine 1996; 15: 2733–2749.
Higgins JPT, Thompson SG, Spiegelhalter DJ. A re-evaluation of random-effects meta-analysis. Journal of the Royal Statistical Society Series A (Statistics in Society) 2009; 172: 137–159.
Higgins JPT, Jackson D, Barrett JK, Lu G, Ades AE, White IR. Consistency and insconsistency in network meta-analysis: concepts and models for multi-arm studies. Research Synthesis Methods 2012; 3: 98–110.
Hutton B, Salanti G, Caldwell DM, Chaimani A, Schmid CH, Cameron C, Ioannidis JPA, Straus S, Thorlund K, Jansen JP, Mulrow C, Catalá-López F, Gøtzsche PC, Dickersin K, Boutron I, Altman DG, Moher D. The PRISMA extension statement for reporting of systematic reviews incorporating network meta-analyses of health care interventions: checklist and explanations. Annals of Internal Medicine 2015; 162: 777–784.
Jackson D, Riley R, White IR. Multivariate meta-analysis: potential and promise. Statistics in Medicine 2011; 30: 2481–2498.
Jackson D, Barrett JK, Rice S, White IR, Higgins JPT. A design-by-treatment interaction model for network meta-analysis with random inconsistency effects. Statistics in Medicine 2014; 33: 3639–3654.
James A, Yavchitz A, Ravaud P, Boutron I. Node-making process in network meta-analysis of nonpharmacological treatment are poorly reported. Journal of Clinical Epidemiology 2018; 97: 95–102.
Jansen JP, Naci H. Is network meta-analysis as valid as standard pairwise meta-analysis? It all depends on the distribution of effect modifiers. BMC Medicine 2013; 11: 159.
Jansen JP, Trikalinos T, Cappelleri JC, Daw J, Andes S, Eldessouki R, Salanti G. Indirect treatment comparison/network meta-analysis study questionnaire to assess relevance and credibility to inform health care decision making: an ISPOR-AMCP-NPC good practice task force report. Value in Health 2014; 17: 157–173.
König J, Krahn U, Binder H. Visualizing the flow of evidence in network meta-analysis and characterizing mixed treatment comparisons. Statistics in Medicine 2013; 32: 5414–5429.
Krahn U, Binder H, Konig J. A graphical tool for locating inconsistency in network meta-analyses. BMC Medical Research Methodology 2013; 13: 35.
Li T, Dickersin K. Citation of previous meta-analyses on the same topic: a clue to perpetuation of incorrect methods? Ophthalmology 2013; 120: 1113–1119.
Lu G, Ades AE. Combination of direct and indirect evidence in mixed treatment comparisons. Statistics in Medicine 2004; 23: 3105–3124.
Lu G, Ades AE. Assessing evidence inconsistency in mixed treatment comparisons. Journal of the American Statistical Association 2006; 101: 447–459.
Lu G, Ades A. Modeling between-trial variance structure in mixed treatment comparisons. Biostatistics 2009; 10: 792–805.
Lu G, Welton NJ, Higgins JPT, White IR, Ades AE. Linear inference for mixed treatment comparison meta-analysis: a two-stage approach. Research Synthesis Methods 2011; 2: 43–60.
Madan J, Stevenson MD, Cooper KL, Ades AE, Whyte S, Akehurst R. Consistency between direct and indirect trial evidence: is direct evidence always more reliable? Value in Health 2011; 14: 953–960.
Madan J, Chen Y-F, Aveyard P, Wang D, Yahaya I, Munafo M, Bauld L, Welton N. Synthesis of evidence on heterogeneous interventions with multiple outcomes recorded over multiple follow-up times reported inconsistently: a smoking cessation case-study. Journal of the Royal Statistical Society: Series A (Statistics in Society) 2014; 177: 295–314.
Mavridis D, Salanti G. A practical introduction to multivariate meta-analysis. Statistical Methods in Medical Research 2013; 22: 133–158.
Mawdsley D, Bennetts M, Dias S, Boucher M, Welton N. Model-based network meta-analysis: a framework for evidence synthesis of clinical trial data. CPT: Pharmacometrics & Systems Pharmacology 2016; 5: 393–401.
Middleton LJ, Champaneria R, Daniels JP, Bhattacharya S, Cooper KG, Hilken NH, O’Donovan P, Gannon M, Gray R, Khan KS, International Heavy Menstrual Bleeding Individual Patient Data Meta-analysis Collaborative G, Abbott J, Barrington J, Bhattacharya S, Bongers MY, Brun JL, Busfield R, Sowter M, Clark TJ, Cooper J, Cooper KG, Corson SL, Dickersin K, Dwyer N, Gannon M, Hawe J, Hurskainen R, Meyer WR, O’Connor H, Pinion S, Sambrook AM, Tam WH, Zon-Rabelink IAA, Zupi E. Hysterectomy, endometrial destruction, and levonorgestrel releasing intrauterine system (Mirena) for heavy menstrual bleeding: systematic review and meta-analysis of data from individual patients. BMJ 2010; 341: c3929.
Nikolakopoulou A, Chaimani A, Veroniki AA, Vasiliadis HS, Schmid CH, Salanti G. Characteristics of networks of interventions: a description of a database of 186 published networks. PloS One 2014; 9: e86754.
Owen RK, Tincello DG, Keith RA. Network meta-analysis: development of a three-level hierarchical modeling approach incorporating dose-related constraints. Value in Health 2015; 18: 116–126.
Petropoulou M, Nikolakopoulou A, Veroniki AA, Rios P, Vafaei A, Zarin W, Giannatsi M, Sullivan S, Tricco AC, Chaimani A, Egger M, Salanti G. Bibliographic study showed improving statistical methodology of network meta-analyses published between 1999 and 2015. Journal of Clinical Epidemiology 2016; 82: 20–28.
Puhan MA, Schünemann HJ, Murad MH, Li T, Brignardello-Petersen R, Singh JA, Kessels AG, Guyatt GH; GRADE Working Group. A GRADE Working Group approach for rating the quality of treatment effect estimates from network meta-analysis. BMJ 2014; 349: g5630.
Riley RD, Higgins JPT, Deeks JJ. Interpretation of random effects meta-analyses. BMJ 2011; 342: d549.
Rücker G. Network meta-analysis, electrical networks and graph theory. Research Synthesis Methods 2012; 3: 312–324.
Rücker G, Schwarzer G. netmeta: an R package for network meta-analysis 2013. http://www.r-project.org.
Rücker G, Schwarzer G. Ranking treatments in frequentist network meta-analysis works without resampling methods. BMC Medical Research Methodology 2015; 15: 58.
Salanti G, Higgins JPT, Ades AE, Ioannidis JPA. Evaluation of networks of randomized trials. Statistical Methods in Medical Research 2008; 17: 279–301.
Salanti G, Marinho V, Higgins JPT. A case study of multiple-treatments meta-analysis demonstrates that covariates should be considered. Journal of Clinical Epidemiology 2009; 62: 857–864.
Salanti G, Ades AE, Ioannidis JPA. Graphical methods and numerical summaries for presenting results from multiple-treatment meta-analysis: an overview and tutorial. Journal of Clinical Epidemiology 2011; 64: 163–171.
Salanti G. Indirect and mixed-treatment comparison, network, or multiple-treatments meta-analysis: many names, many benefits, many concerns for the next generation evidence synthesis tool. Research Synthesis Methods 2012; 3: 80–97.
Salanti G, Del Giovane C, Chaimani A, Caldwell DM, Higgins JPT. Evaluating the quality of evidence from a network meta-analysis. PloS One 2014; 9: e99682.
Schmitz S, Adams R, Walsh C. Incorporating data from various trial designs into a mixed treatment comparison model. Statistics in Medicine 2013; 32: 2935–2949.
Schwarzer G, Carpenter JR, Rücker G. Meta-analysis with R. Cham: Springer; 2015.
Sobieraj DM, Cappelleri JC, Baker WL, Phung OJ, White CM, Coleman CI. Methods used to conduct and report Bayesian mixed treatment comparisons published in the medical literature: a systematic review. BMJ Open 2013; 3: pii.
Song F, Altman DG, Glenny AM, Deeks JJ. Validity of indirect comparison for estimating efficacy of competing interventions: empirical evidence from published meta-analyses. BMJ 2003; 326: 472.
Song F, Xiong T, Parekh-Bhurke S, Loke YK, Sutton AJ, Eastwood AJ, Holland R, Chen YF, Glenny AM, Deeks JJ, Altman DG. Inconsistency between direct and indirect comparisons of competing interventions: meta-epidemiological study. BMJ 2011; 343: d4909.
Song F, Clark A, Bachmann MO, Maas J. Simulation evaluation of statistical properties of methods for indirect and mixed treatment comparisons. BMC Medical Research Methodology 2012; 12: 138.
Tan SH, Bujkiewicz S, Sutton A, Dequen P, Cooper N. Presentational approaches used in the UK for reporting evidence synthesis using indirect and mixed treatment comparisons. Journal of Health Services Research and Policy 2013; 18: 224–232.
Tan SH, Cooper NJ, Bujkiewicz S, Welton NJ, Caldwell DM, Sutton AJ. Novel presentational approaches were developed for reporting network meta-analysis. Journal of Clinical Epidemiology 2014; 67: 672–680.
Thijs V, Lemmens R, Fieuws S. Network meta-analysis: simultaneous meta-analysis of common antiplatelet regimens after transient ischaemic attack or stroke. European Heart Journal 2008; 29: 1086–1092.
Turner RM, Davey J, Clarke MJ, Thompson SG, Higgins JPT. Predicting the extent of heterogeneity in meta-analysis, using empirical data from the Cochrane Database of Systematic Reviews. International Journal of Epidemiology 2012; 41: 818–827.
Veroniki AA, Vasiliadis HS, Higgins JPT, Salanti G. Evaluation of inconsistency in networks of interventions. International Journal of Epidemiology 2013; 42: 332–345.
Veroniki AA, Mavridis D, Higgins JPT, Salanti G. Characteristics of a loop of evidence that affect detection and estimation of inconsistency: a simulation study. BMC Medical Research Methodology 2014; 14: 106.
White IR, Barrett JK, Jackson D, Higgins JPT. Consistency and inconsistency in network meta-analysis: model estimation using multivariate meta-regression. Research Synthesis Methods 2012; 3: 111–125.
White IR. Network meta-analysis. Stata Journal 2015; 15: 951–985.