Matthew J Page, Julian PT Higgins, Jonathan AC Sterne
Key Points:
- Systematic reviews seek to identify all research that meets the eligibility criteria. However, this goal can be compromised by ‘non-reporting bias’: when decisions about how, when or where to report results of eligible studies are influenced by the P value, magnitude or direction of the results.
- There is convincing evidence for several types of non-reporting bias, reinforcing the need for review authors to search all possible sources where study reports and results may be located. It may be necessary to consult multiple bibliographic databases, trials registers, manufacturers, regulators and study authors or sponsors.
- Risk of bias in a meta-analysis result can arise when either an entire study report or a particular study result is unavailable selectively (e.g. because the P value, magnitude or direction of the results were considered unfavourable by the investigators). In each case, available evidence differs systematically from missing evidence.
- Several approaches for assessing risk of bias due to missing evidence have been suggested. A thorough assessment of selective non-reporting or under-reporting of results in the studies identified is likely to be the most valuable. Because the number of identified studies that have results missing for a given meta-analysis is known, the impact of selective non-reporting or under-reporting of results can be quantified more easily than the impact of selective non-publication of an unknown number of studies.
- Funnel plots (and the tests used for examining funnel plot asymmetry) may help review authors to identify evidence of non-reporting biases in cases where protocols or trials register records were unavailable for most studies. However, they have well-documented limitations.
- When there is evidence of funnel plot asymmetry, non-reporting biases should be considered as only one of a number of possible explanations. In these circumstances, review authors should attempt to understand the source(s) of the asymmetry, and consider their implications in the light of any qualitative signals that raise a suspicion of additional missing evidence, and other sensitivity analyses.
Cite this chapter as: Page MJ, Higgins JPT, Sterne JAC. Chapter 13: Assessing risk of bias due to missing evidence in a meta-analysis [last updated August 2024]. In: Higgins JPT, Thomas J, Chandler J, Cumpston M, Li T, Page MJ, Welch VA (editors). Cochrane Handbook for Systematic Reviews of Interventions version 6.5. Cochrane, 2024. Available from cochrane.org/handbook.
13.1 Introduction
Systematic reviews seek to identify all research that meets pre-specified eligibility criteria. This goal can be compromised if decisions about how, when or where to report results of eligible studies are influenced by the P value, magnitude or direction of the study’s results. For example, ‘statistically significant’ results that suggest an intervention works are more likely than ‘statistically non-significant’ results to be available, available rapidly, available in high impact journals and cited by others, and hence more easily identifiable for systematic reviews. The term ‘reporting bias’ has often been used to describe this problem, but we prefer the term non-reporting bias.
Non-reporting biases lead to bias due to missing evidence in a systematic review. Meta-analyses are at risk of bias due to missing evidence when results of some eligible studies are unavailable because of the P value, magnitude or direction of the results. Bias due to missing evidence differs from a related source of bias – bias in selection of the reported result – where study authors select a result for reporting from among multiple measurements or analyses, on the basis of the P value, magnitude or direction of the results. In such cases, the study result that is available for inclusion in the meta-analysis is at risk of bias. Bias in selection of the reported result is described in more detail in Chapter 7, and addressed in the RoB 2 tool (Chapter 8) and ROBINS-I tool (Chapter 25).
We structure the chapter as follows. We start by discussing approaches for avoiding or minimizing bias due to missing evidence in systematic reviews in Section 13.2, and provide guidance for assessing the risk of bias due to missing evidence in Section 13.3. For the purpose of discussing these biases, ‘statistically significant’ (P <0.05) results are sometimes denoted as ‘positive’ results and ‘statistically non-significant’ or null results as ‘negative’ results. As explained in Chapter 15, Cochrane Review authors should not use any of these labels when reporting their review findings, since they are based on arbitrary thresholds and may not reflect the clinical or policy significance of the findings.
In this chapter, we use the term study result to describe the combination of a point estimate (such as a mean difference or risk ratio) and a measure of its precision (such as a confidence interval), or the summary statistics required to calculate these for a particular study outcome. We use the term study outcome to refer to an outcome measurement collected on, or by, participants in a study; the measurement could be continuous or non-continuous (e.g. a dichotomous outcome or time to an event). When fully defined, an outcome for an individual participant includes the following elements: an outcome domain; a specific measure; a specific metric; and a time point (Zarin et al 2011) An example of a fully defined outcome is ‘a 50% change from baseline to eight weeks on the Montgomery-Asberg Depression Rating Scale total score’. A corresponding result for this outcome additionally requires a method of aggregation across individuals: here it might be a risk ratio with 95% confidence interval, which estimates the between-group difference in the proportion of people with the outcome.
13.2 Minimizing risk of bias due to missing evidence
The convincing evidence for the presence of non-reporting biases, summarized in Chapter 7, Section 7.2.3, should be of great concern to review authors. Regardless of whether an entire study report or a particular study result is unavailable selectively (e.g. because the P value, magnitude or direction of the results were considered unfavourable by the investigators), the same consequence can arise: risk of bias in a meta-analysis result because available evidence differs systematically from missing evidence. We discuss two means of reducing, or potentially avoiding, bias due to missing evidence.
13.2.1 Inclusion of results from sources other than published reports
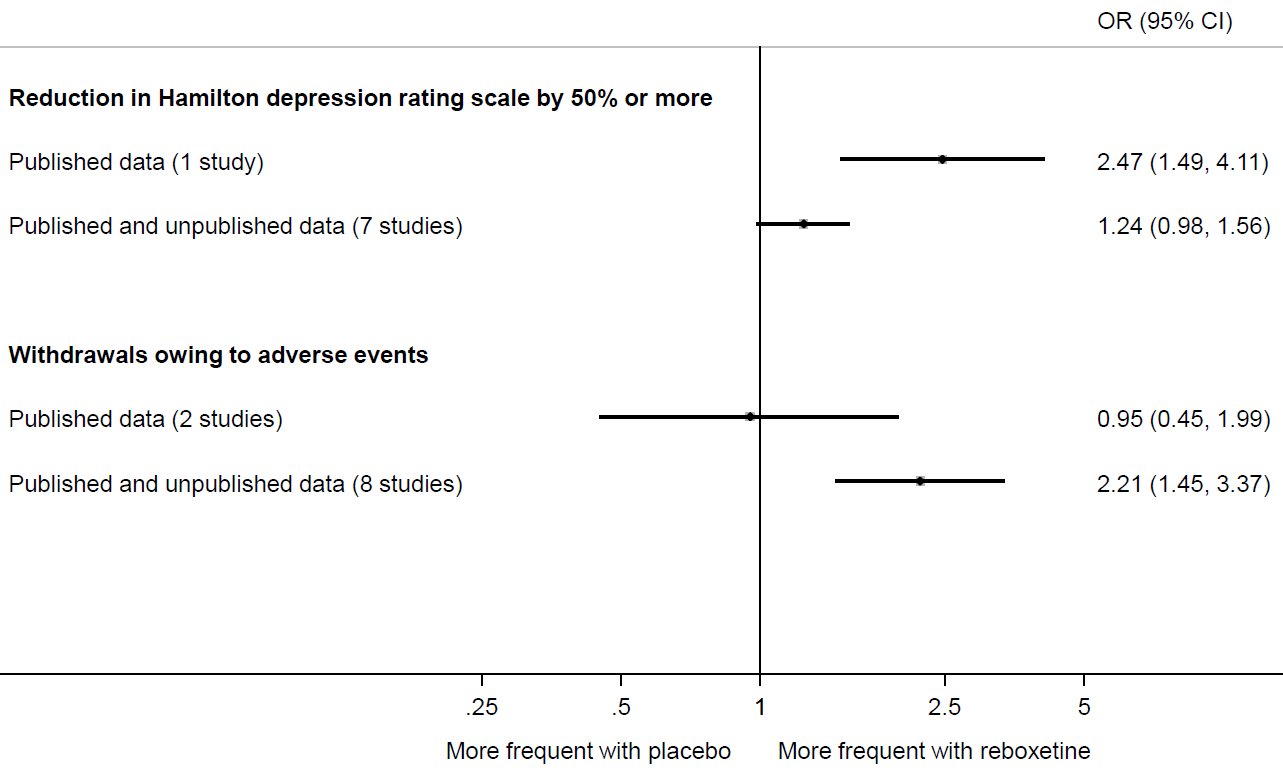
Eyding and colleagues provide a striking example of the value of searching beyond the published literature (Eyding et al 2010). They sought data from published trials of reboxetine versus placebo for major depression, as well as unpublished data from the manufacturer (Pfizer, Berlin). Of 13 trials identified, data for only 26% were published. Meta-analysis painted a far rosier picture of the effects of reboxetine when restricted to the published results (Figure 13.2.a). For example, the between-group difference in the number of patients with an important reduction in depression was much larger in the published trial compared with a meta-analysis of the published and unpublished trials. Similarly, a meta-analysis of two published trials suggested a negligible difference between reboxetine and placebo in the number of patients who withdrew because of adverse events. However, when six unpublished trials were added, the summary estimate suggested that patients on reboxetine were more than twice as likely to withdraw (Eyding et al 2010).
Figure 13.2.a Results of meta-analyses of reboxetine versus placebo for acute treatment of major depression, with or without unpublished data (data from (Eyding et al 2010). Reproduced with permission of BMJ Publishing Group
Cases such as this illustrate how bias in a meta-analysis result can be reduced by the inclusion of missing evidence. In other situations, the bias reduction may not be so dramatic. Schmucker and colleagues reviewed five methodological studies examining the difference in summary effect estimates of 173 meta-analyses that included or omitted results from sources other than journal articles (e.g. conference abstracts, theses, government reports, regulatory websites) (Schmucker et al 2017). They found that the direction and magnitude of the differences in summary estimates varied. While inclusion of unreported results may not change summary estimates markedly in all cases, doing so often leads to an increase in precision of the summary estimates (Schmucker et al 2017). Guidance on searching for unpublished sources is included in Chapter 4, Section 4.3.
13.2.1.1 Inclusion of results from trials results registers
As outlined in Chapter 4 (Section 4.3.3), trials registers can be used to identify any initiated, ongoing or completed (but not necessarily published) studies that meet the eligibility criteria of a review. In 2008, ClinicalTrials.gov created data fields to accept summary results for any registered trial (Zarin et al 2011). A search of ClinicalTrials.gov in May 2024 retrieved almost half a million studies, of which summary results were reported for around 63,000 (13%). Empirical evidence suggests that including results from ClinicalTrials.gov can lead to important changes in the results of some meta-analyses. When Baudard and colleagues searched trials registers for 95 systematic reviews of pharmaceutical interventions that had not already done so, they identified 122 trials that were eligible for inclusion in 41 (47%) of the reviews (Baudard et al 2017). Results for 45 of the 122 trials were available and could be included in a meta-analysis in 14 of the reviews. The percentage change in meta-analytic effects after including results from trials registers was greater than 10% for five of the 14 reviews and greater than 20% for two reviews; in almost all cases the revised meta-analysis showed decreased efficacy of the drug (Baudard et al 2017). Changes in meta-analysis results were less evident in a similarly designed study by Alqaidoom and colleagues (Alqaidoom et al 2023). However, this might be because the investigators included meta-analyses of trials of non-pharmacological interventions, which are less likely to be registered than trials of pharmacological interventions. Several initiatives are underway to increase results posting in ClinicalTrials.gov and the European Union Clinical Trials Register (DeVito et al 2018, Goldacre et al 2018). Therefore, trials registers should become even more valuable as a mechanism to minimize bias in systematic reviews as more trialists make use of them.
13.2.1.2 Inclusion of results from clinical study reports and other regulatory documents
Another way to minimize risk of bias due to missing evidence in reviews of regulated interventions (e.g. drugs, biologics) is to seek clinical study reports (CSRs) and other regulatory documents, such as FDA Drug Approval Packages (see Chapter 4, Section 4.3.4). CSRs are comprehensive documents submitted by pharmaceutical companies in an application for regulatory approval of a product (Jefferson et al 2018), while FDA Drug Approval Packages (at the Drugs@FDA website) include summaries of CSRs and related documents, written by FDA staff (Ladanie et al 2018) (see Chapter 5, Section 5.5.6 and Section 5.5.7). For some trials, regulatory data are the only source of information about the trial. Comparisons of the results available in regulatory documents with results available in corresponding journal articles have revealed that unfavourable results for benefit outcomes and adverse events are largely under-reported in journal articles (Wieseler et al 2013, Maund et al 2014, Schroll et al 2016, Turner et al 2022). A few systematic reviews have found that conclusions about the benefits and harms of interventions changed after regulatory data were included in the review (Turner et al 2008, Rodgers et al 2013, Jefferson et al 2014).
CSRs and other regulatory documents have great potential for improving the credibility of systematic reviews of regulated interventions, but substantial resources are needed to access them and disentangle the data within them (Schroll et al 2015, Doshi and Jefferson 2016). Only limited guidance is currently available for review authors considering embarking on a review including regulatory data. Jefferson and colleagues provide criteria for assessing whether to include regulatory data for a drug or biologic in a systematic review (Jefferson et al 2018). The RIAT (Restoring Invisible and Abandoned Trials) Support Center website provides useful information, including a taxonomy of regulatory documents, a glossary of relevant terms, guidance on how to request CSRs from regulators and contact information for making requests (Doshi et al 2018). Also, Ladanie and colleagues provide guidance on how to access and use FDA Drug Approval Packages for evidence syntheses (Ladanie et al 2018).
13.2.2 Restriction of meta-analysis to inception cohorts
Review authors can sometimes reduce the risk of bias due to missing evidence by limiting the type of studies that are eligible for inclusion. Because systematic reviews traditionally search comprehensively for completed studies, non-reporting biases, poor indexing and other factors make it impossible to know whether all studies were in fact identified. An alternative approach is to review an inception cohort of studies. An inception cohort refers to a set of studies known to have been initiated, irrespective of their results (e.g. selecting studies only from trials registers) (Dwan et al 2013). This means there is a full accounting of which studies do and do not have results available.
There are various ways to assemble an inception cohort. Review authors could pre-specify that studies will be included only if they were registered prospectively (e.g. registered before patient enrolment in public, industry or regulatory registers (Roberts et al 2015, Jørgensen et al 2018) or in grants databases such as NIH RePORTER (Driessen et al 2015). Or, review authors may obtain unabridged access to reports of all studies of a product conducted by a particular manufacturer (Simmonds et al 2013). Alternatively, a clinical trial collaborative group may prospectively plan to undertake multiple trials using similar designs, participants, interventions and outcomes, and synthesize the findings of all trials once completed (‘prospective meta-analysis’; see Chapter 22) (Askie et al 2018).The benefit of these strategies is that review authors can identify all eligible studies regardless of the P value, magnitude or direction of any result.
Limiting inclusion to prospectively registered studies avoids the possibility of missing any eligible studies. However, results of these studies may still be missing. Therefore, review authors would need to assess the availability of results for each study identified (guidance on how to do so is provided in Section 13.3.3). If none of the prospectively registered studies suffer from selective non-reporting or under-reporting of results, then none of the meta-analysis will be at risk of bias due to missing results. Conversely, if some results are missing selectively, then there may be a risk of bias in the meta-analysis result, particularly if the total amount of data missing is large (for more details see Section 13.3.3).
Reliance on trials registers to assemble an inception cohort may not be ideal in all instances. Prospective registration of trials started to increase only after 2004, when the International Committee of Medical Journal Editors announced that they would no longer publish trials that were not registered at inception (De Angelis et al 2004). For this reason, review authors are unlikely to identify any prospectively registered trials of interventions that were investigated only prior to this time. Also, until quite recently there have been fewer incentives to register prospectively trials of non-regulated interventions (Dal-Ré et al 2015), and unless registration rates increase, systematic reviews of such interventions are unlikely to identify many prospectively registered trials.
Restricting a meta-analysis to an inception cohort therefore involves a trade-off between bias, precision and applicability. For example, limiting inclusion to prospectively registered trials will avoid risk of bias due to missing evidence if no results are missing from a meta-analysis selectively. However, the precision of the meta-analysis may be low if there are only a few, small, prospectively registered trials. Also, the summary estimate from the meta-analysis may have limited applicability to the review question if the questions asked in the prospectively registered trials are narrower in scope than the questions asked in unregistered or retrospectively registered trials. Therefore, as with any meta-analysis, review authors will need to consider precision and applicability when interpreting the meta-analysis findings (methods for doing so are covered in Chapter 14 and Chapter 15).
13.3 The ROB-ME tool for assessing risk of bias due to missing evidence in a meta-analysis
The strategies outlined in Section 13.2 have a common goal: to prevent bias due to missing evidence in systematic reviews. However, neither strategy is infallible on its own. For example, review authors may have been able to include results from ClinicalTrials.gov for several unpublished trials, yet unable to obtain unreported results for other trials. Unless review authors can eliminate the potential for bias due to missing evidence (e.g. through prospective meta-analysis; see Chapter 22), they should formally assess the risk of this bias in their review.
Several methods are available for assessing non-reporting biases. For example, Page and colleagues identified 15 scales, checklists and domain-based tools designed for this purpose (Page et al 2018). In addition, many graphical and statistical approaches seeking to assess non-reporting biases have been developed (including funnel plots and statistical tests for funnel plot asymmetry) (Mueller et al 2016, Marks-Anglin and Chen 2020).
In this section we describe the ROB-ME (“Risk Of Bias due to Missing Evidence”) tool for assessing the risk of bias due to missing evidence in a meta-analysis. ROB-ME is the first structured approach for assessing the risk of bias that arises when entire studies, or particular results within studies, are missing from a meta-analysis because of the P value, magnitude or direction of the study results (Page et al 2023). The full documentation for the ROB-ME tool, including templates for download, is available at https://www.riskofbias.info/.
The ROB-ME tool is designed to assess risk of bias due to missing evidence in a meta-analysis comparing the effects of two interventions, regardless of the number and types of studies with results available for inclusion in the meta-analysis, including in cases where only one of the studies identified has results available. A tool for assessing risk of bias due to missing evidence in network meta-analyses (ROB-MEN) is also available and described elsewhere (Chiocchia et al 2021). The issue of non-reporting bias has received little attention in the context of syntheses of qualitative research (Toews et al 2017) and non-standard syntheses of quantitative data (described in Chapter 12), so more work is needed to develop methods relevant to these types of evidence synthesis.
If review authors are unable, or choose not, to generate a summary meta-analytic estimate, then the complete ROB-ME tool cannot be applied. Nevertheless, review authors should not ignore any missing results when drawing conclusions in this situation (see Chapter 12). For example, the primary outcome in the Cochrane Review of latrepirdine for Alzheimer’s disease (Chau et al 2015) was clinical global impression of change, measured by CIBIC-Plus (Clinician’s Interview-Based Impression of Change Plus Caregiver Input). This was assessed in four trials, but results were available for only one, and review authors suspected selective non-reporting of results in the other three. After describing the mean difference in CIBIC-Plus from the trial with results available, the review authors concluded that they were uncertain about the efficacy of latrepirdine on clinical global impression of change, owing to the missing results from three trials.
13.3.1 Planning the risk of bias assessment
13.3.1.1. Selecting meta-analyses to assess for risk of bias
It may not be feasible to assess risk of bias due to missing evidence in all meta-analyses in a review, particularly if many meta-analyses are conducted and many studies are eligible for inclusion in each. Review authors should therefore strive to assess risk of bias due to missing evidence in meta-analyses of outcomes that are most important to patients and health professionals. Such outcomes will typically be included in ‘Summary of findings’ tables (see Chapter 14). Ideally, review authors should pre-specify the meta-analyses for which they plan to assess the risk of bias due to missing evidence.
13.3.1.2 Defining eligible results for the meta-analysis
Review authors should consider what type of results are eligible for inclusion in each selected meta-analysis. Eligibility will depend on the specificity of the planned meta-analysis. For example, a highly specific approach may be to synthesize mean differences from trials measuring depression using a particular instrument (the Beck Depression Inventory (BDI)) at a particular time point (six weeks). A broader approach would be to synthesize mean differences from trials measuring depression using any instrument, at any time up to 12 weeks, while an even broader approach would be to synthesize mean differences from trials measuring any mental health outcome (e.g. depression or anxiety) at any time point (López-López et al 2018). The more specific the meta-analysis, the less likely it is that a given study result is eligible. For example, if a trial has results only for the BDI at two weeks, the result would be eligible for inclusion in a meta-analysis of ‘Depression scores up to 12 weeks’, but ineligible for inclusion in a meta-analysis of ‘BDI scores at six weeks’.
Review authors should aim to define fully the results that are eligible for inclusion in each meta-analysis. This is achieved by specifying eligibility criteria for: outcome domain (e.g. depression), time points (e.g. up to six weeks) and measures/instruments (e.g. BDI or Hamilton Rating Scale for Depression) as discussed in Chapter 3 (Section 3.2.4.3), as well as how effect estimates will be computed in terms of metrics (e.g. post-intervention or change from baseline) and methods of aggregation (e.g. mean scores on depression scales or proportion of people with depression) as discussed in Chapter 6 (Mayo-Wilson et al 2017). It is best to pre-define eligibility criteria for all of these elements, although the measurement instruments, timing and analysis metrics used in studies identified can be difficult to predict, so plans may need to be refined. Failure to define fully which results are eligible makes it far more difficult to assess which results are missing.
How the meta-analysis is defined has implications both for the risk of bias due to missing evidence and the related risk of bias in selection of the reported result, which is addressed in the RoB 2 (Chapter 8) and ROBINS-I (Chapter 25) tools for assessing risk of bias in study results. For example, consider a trial where the BDI was administered at two and six weeks, but the six-week result was withheld because it was statistically non-significant. If the meta-analysis was defined as ‘BDI scores up to eight weeks’, the available two-week result would be eligible. If there were no missing results from other trials, there would be no risk of bias due to missing evidence in this meta-analysis result, because each trial contributed an eligible result. However, the two-week study result would be at high risk of bias in selection of the reported result. This example demonstrates that the risk of bias due to missing evidence in a meta-analysis depends not only on the availability of results in the eligible studies, but also on how review authors define the meta-analysis.
13.3.1.3 Assessing each eligible study for missing results
Once eligible results have been defined for each meta-analysis, review authors can investigate the availability of such results in all studies that are eligible for inclusion in the meta-analyses selected for assessment. Key questions to consider are as follows.
- Are the particular results I am seeking missing for any eligible study?
- If so, are the results missing because of the P value, magnitude or direction of the results?
Review authors should try to identify results that are completely or partially missing because of the P value, magnitude or direction of the results (selective non-reporting or under-reporting of results, respectively). By completely missing, we mean that no information is available to estimate an intervention effect or to make any other inference (including a qualitative conclusion about the direction of effect) in any of the sources identified or from the study authors/sponsors. By partially missing, we mean that some, but not all, of the information necessary to include a result in a meta-analysis is available (e.g. study authors report only that results were ‘non-significant’ rather than providing summary statistics, or they provide a point estimate without any measure of precision) (Chan et al 2004).
There are several ways to detect selective non-reporting or under-reporting of results, although a thorough assessment is likely to be labour intensive. It is helpful to start by assembling all sources of information obtained about each study (see Chapter 4, Section 4.6.2). This may include the trial’s register record, protocol, statistical analysis plan (SAP), reports of the results of the study (e.g. journal articles, CSRs) or any information obtained directly from the study authors or sponsor. The more sources of information sought, the more reliable the assessment is likely to be. Studies should be assessed regardless of whether a report of the results is available. For example, in some cases review authors may only know about an eligible study because there is a record of it registered in ClinicalTrials.gov. If a long time has passed since the study was completed, it is possible that the results are not available because the investigators considered them unworthy of dissemination. Ignoring this registered study with no results available could lead to less concern about the risk of bias due to missing evidence than is warranted.
If study plans are available (e.g. in a trials register, protocol or statistical analysis plan), details of outcomes that were assessed can be compared with those for which results are available. Suspicion is raised if results are unavailable for any outcomes that were pre-specified in these sources. However, outcomes pre-specified in a trials register may differ from the outcomes pre-specified in a trial protocol (Chan et al 2017), and the latest version of a trials register record may differ from the initial version. Such differences may be explained by legitimate, yet undeclared, changes to the study plans: pre-specification of an outcome does not guarantee it was actually assessed. Further information should be sought from study authors or sponsors to resolve any unexplained discrepancies between sources.
If no study plans are available, then other approaches can be used to uncover missing results. Abstracts of presentations about the study may contain partial information about outcomes not subsequently mentioned in publications, or the methods section of a published article may list outcomes not subsequently mentioned in the results section.
Missing information that seems certain to have been recorded is of particular interest. For example, some measurements, such as systolic and diastolic blood pressure, are expected to appear together, so that if only one is reported we should wonder why. Williamson and Gamble give several examples, including a Cochrane Review in which all nine trials reported the outcome ‘treatment failure’ but only five reported mortality (Williamson and Gamble 2005). Since mortality was part of the definition of treatment failure, data on mortality must have been collected in the other four trials. Searches of the Core Outcome Measures in Effectiveness Trials (COMET) database can help review authors identify core sets of outcomes that are expected to have been measured in all trials of particular conditions (Williamson and Clarke 2012), although review authors should keep in mind that trials conducted before the publication of a relevant core outcome set are less likely to have measured the relevant outcomes, and adoption of core outcome sets may not be complete even after they have been published.
If the particular results that review authors seek are not reported in any of the sources identified (e.g. journal article, trials results register, CSR), review authors should consider requesting the required result from the study authors or sponsors. Authors or sponsors may be able to calculate the result for the review authors or send the individual participant data for review authors to analyse themselves. Failure to obtain the results requested should be acknowledged when discussing the limitations of the review process. In some cases, review authors might be able to compute or impute missing details (e.g. imputing standard deviations; see Chapter 6, Section 6.5.2).
Once review authors have identified that a study result is missing, they should consider whether this is because of the P value, magnitude or direction of the result. The ROB-ME tool suggests using a modification of the Outcome Reporting Bias In Trials (ORBIT) system for classifying reasons for missing results (Kirkham et al 2018) to do this. Examples of scenarios where it may be reasonable to assume that a result is not missing because of the P value, magnitude or direction of the result include:
- it is clear (or very likely) that the outcome of interest was not measured in the study (based on examination of the study protocol or SAP, or correspondence with the authors/sponsors);
- the instrument or equipment needed to measure the outcome of interest was not available at the time the study was conducted; and
- the outcome of interest was measured but data were not analysed owing to a fault in the measurement instrument.
Examples of scenarios where it may be reasonable to suspect that a result is missing because of the P value, magnitude or direction of the result include:
- study authors claimed to have measured the outcome, but no results were available and no explanation for this is provided;
- the between-group difference for the result of interest was reported as being ‘non-significant’, whereas summary statistics (e.g. means and standard deviations) per intervention group were available for other outcomes in the study when the difference was statistically significant;
- results are missing for an outcome that tends to be measured together with another (e.g. results are available for cause-specific mortality and are favourable to the experimental intervention, yet results for all-cause mortality, which must have been assessed given cause-specific mortality was also assessed, are missing);
- summary statistics (number of events, or mean scores) are available only globally across all groups (e.g. study authors claim that 10 of 100 participants in the trial experienced adverse events, but do not report the number of events by intervention group); and
- the outcome is expected to have been measured, and the study is conducted by authors or sponsored by an organization with a vested interest in the intervention who may be inclined to withhold results that are unfavourable to the intervention (guidance on assessing conflicts of interest is provided in Chapter 7).
Typically, selective non-reporting or under-reporting of results manifests as the suppression of results that are statistically non-significant or unfavourable to the experimental intervention. However, in some instances the opposite may occur. For example, a trialist who believes that an intervention is ineffective may choose not to report results indicating a difference in favour of the intervention over placebo. Therefore, review authors should consider the interventions being compared when considering reasons for missing results.
Users of the ROB-ME tool are encouraged to construct a matrix (with rows as studies and columns as meta-analyses) indicating the availability of study results for each synthesis to be assessed for risk of bias due to missing evidence. Table 13.3.a shows an example of a matrix indicating the availability of results for three meta-analyses in a Cochrane Review comparing selective serotonin reuptake inhibitors (SSRIs) with placebo for fibromyalgia (Walitt et al 2015). Results were available from all trials for the meta-analysis of ‘number of patients with at least 30% pain reduction’. For the meta-analysis of ‘mean fatigue scores’, results were unavailable for two trials, but for a reason unrelated to the P value, magnitude or direction of the results (fatigue was not measured in these studies). For the meta-analysis of ‘mean depression scores’, results were unavailable for one study, likely on the basis of the P value (the trialists reported only that there was a ‘non-significant’ difference between groups, and review authors’ attempts to obtain the necessary data for the synthesis were unsuccessful).
Table 13.3.a Matrix indicating availability of study results for three meta-analysis of trials comparing selective serotonin reuptake inhibitors (SSRIs) with placebo for fibromyalgia (Walitt et al 2015)
|
Study ID |
Sample size (SSRI) |
Sample size (placebo) |
Meta-analyses assessed for risk of bias |
|||
|
No. with at least 30% pain reduction |
Mean fatigue scores (any scale) |
Mean depression scores (any scale) |
||||
|
Anderberg 2000 |
17 |
18 |
✓ |
✓ |
✓ |
|
|
Arnold 2002 |
25 |
26 |
✓ |
✓ |
✓ |
|
|
Goldenberg 1996 |
22 |
19 |
✓ |
✓ |
✓ |
|
|
GSK 2005 |
26 |
26 |
✓ |
~ |
✓ |
|
|
Norregaard 1995 |
20 |
21 |
✓ |
✓ |
✓ |
|
|
Patkar 2007 |
58 |
58 |
✓ |
~ |
X |
|
|
Wolfe 1994 |
15 |
9 |
✓ |
✓ |
✓ |
|
Key:
✓ A study result is available for inclusion in the meta-analysis.
~ No study result is available for inclusion in the meta-analysis, for a reason unrelated to the P value, magnitude or direction of the result.
? Unclear whether an eligible study result was generated.
X No study result is available for inclusion in the meta-analysis, likely because of the P value, magnitude or direction of the results generated.
13.3.1.4 Considering the potential for missing studies across the systematic review
After assessing missingness of results in the studies identified, users need to consider whether additional eligible studies were not identified because of the P value, magnitude, or direction of their results. Whether additional studies are likely to be missing will depend on how studies are defined to be eligible for inclusion in the review. If only studies in an inception cohort (e.g. prospectively registered trials) are eligible, then by design none of the studies will have been missed. If studies outside an inception cohort are eligible, then review authors should consider how comprehensive their search was. A search of MEDLINE alone is unlikely to have captured all relevant studies, and failure to search specialized databases such as CINAHL and PsycINFO when the topic of the review is related to the focus of the database may increase the chances that eligible studies were missed (Bramer et al 2017). If evaluating an intervention that is often delivered in countries speaking a language other than English (e.g. traditional Chinese medicine interventions), it may be reasonable to assume additional eligible studies are likely to have been missed if the search is limited to databases containing only English-language articles (Morrison et al 2012).
If the research area is fast-moving, the availability of study information may be subject to time-lag bias, where studies with positive results are available more quickly than those with negative results (Hopewell et al 2007). If results of only a few, early studies are available, it may be reasonable to assume that a meta-analysis is missing results from additional studies that have been conducted but not yet disseminated. In addition, phase III clinical trials (generally larger trials at a late stage of intervention development) are more likely to be published than phase II clinical trials (smaller trials at an earlier stage of intervention development): odds ratio 2.0 (95% CI 1.6 to 2.5) (Schmucker et al 2014). Therefore, review authors might be more concerned that there are additional missing studies when evaluating a new biomedical intervention that has not yet reached phase III testing than when evaluating an established intervention for which results of phase III trials are available.
The extent to which a study can be suppressed varies. For example, trials of population-wide screening programmes or mass media campaigns are often expensive, require many years of follow-up, and involve hundreds of thousands of participants. It is more difficult to hide such studies from the public than trials that can be conducted quickly and inexpensively. Therefore, review authors should consider the typical size and complexity of eligible studies when considering the likelihood of additional missing studies.
13.3.2 Assessing a specific meta-analysis result
The ROB-ME tool (Page et al 2023) comprises eight signalling questions that seek to elicit information relevant to an assessment of risk of bias for each meta-analysis. Four questions relate to non-reporting bias within studies (Section 13.3.3) and four to risk of non-reporting bias across studies (Section 13.3.4). Responses to some questions are informed by material collated in the planning stage of the assessment (described in Section 13.3.1). The response options for the signalling questions are: Yes; Probably yes; Probably no; No; No information; and Not applicable. To maximise clarity, the questions are phrased such that a response of “Yes” indicates higher risk of bias and “No” indicates lower risk of bias. Responses of “Yes” and “Probably yes” have the same implications for risk of bias as do responses of “No” and “Probably no”, with the “Probably” versions selected typically when firm evidence is lacking, and some judgement has been made. Guidance on how to answer each signalling question is provided in the tool available at https://www.riskofbias.info/.
13.3.3. Signalling questions relating to the assessment of non-reporting bias within studies: the ‘known unknowns’
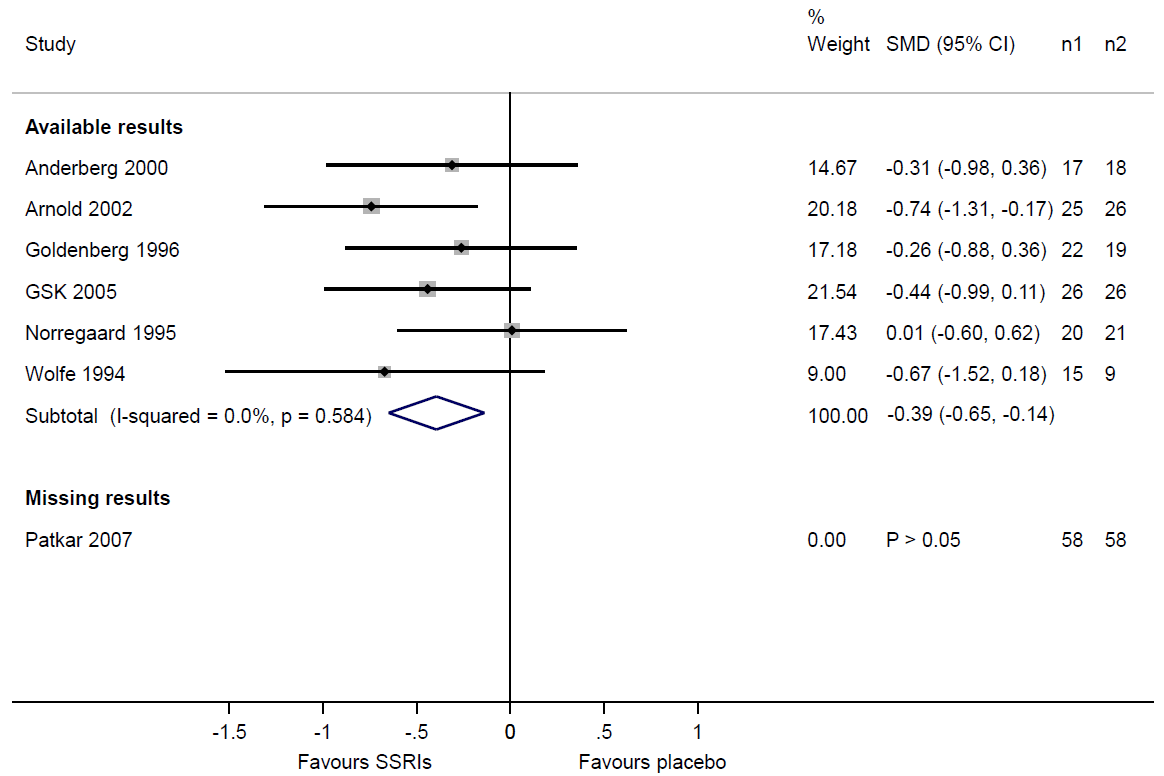
The first four signalling questions require users to consider the extent of missing results in studies assessed for selective non-reporting or under-reporting of results (using the methods outlined in Section 13.3.1.3). If review authors suspect that some study results are missing because of the P value, magnitude or direction of the results, they should consider the potential impact of the missingness on the meta-analysis. Table 13.3.a shows that review authors suspected selective non-reporting of results for depression scores in the Patkar 2007 trial. A useful device is to draw readers’ attention to this by displaying the trial in a forest plot, underneath a meta-analysis of the trials with available results (Figure 13.3.a). Examination of the sample sizes of the trials with available and missing results shows that nearly one-third of the total sample size across all eligible trials ((58+58)/(125+119+58+58)=0.32) comes from the Patkar 2007 trial. Given that we know the result for the Patkar 2007 trial to be statistically non-significant, it would be reasonable to suspect that its inclusion in the meta-analysis would reduce the magnitude of the summary estimate. Thus, there is a risk of bias due to missing evidence in the meta-analysis of depression scores.
Figure 13.3.a Forest plot displaying available and missing results for a meta-analysis of depression scores (data from Walitt et al 2015). Reproduced with permission of John Wiley and Sons
In other cases, knowledge of the size of eligible studies may lead to reassurance that a meta-analysis is unlikely to be biased due to missing evidence. For example, López-López and colleagues performed a network meta-analysis of trials of oral anticoagulants for prevention of stroke in atrial fibrillation (López-López et al 2017). Among the five larger phase III trials comparing a direct acting oral anticoagulant with warfarin (each of which included thousands or tens of thousands of participants), results were fully available for important outcomes including stroke or systemic embolism, ischaemic stroke, myocardial infarction, all-cause mortality, major bleeding, intracranial bleeding and gastrointestinal bleeding. The review authors felt that the inability to include results for these outcomes from a few much smaller eligible trials (with at most a few hundred participants) was unlikely to change the summary estimates of these meta-analyses (López-López et al 2017).
When the amount of data missing from the meta-analysis due to selective non-reporting or under-reporting of results is very high, review authors may decide not to report a meta-analysis of the studies with results available, on the basis that such a summary estimate could be seriously biased. In other cases, review authors may be uncertain whether selective non-reporting or under-reporting of results occurred, because it was unclear whether the outcome of interest was even assessed. This uncertainty may arise when study plans (e.g. trials register record or protocol) were unavailable, and studies in the field are known to vary in what they assess. If outcome assessment was unclear for a large proportion of the studies identified, review authors might be wary when drawing conclusions about the meta-analysis, and alert users to the possibility that it could be missing results from these studies.
13.3.4 Signalling questions relating to the assessment of non-reporting bias across studies: the ‘unknown unknowns
The latter four signalling questions require users to consider the risk that the meta-analysis result is biased because additional studies or study results, beyond those already identified, are missing. In this section, we describe various approaches users could adopt to inform such considerations.
13.3.4.1 Circumstances indicating potential for additional missing results
In the planning stage of the ROB-ME assessment, users are asked to consider the potential for missing studies across the systematic review (see Section 13.3.1.4). If circumstances suggest there is potential for missing studies, users need to consider whether it is likely that studies not identified had eligible results because, for example, the outcome is typically measured in all studies on the topic.
Core outcome sets that have been in existence for a long time might be helpful for identifying outcomes that would be expected to be measured in all studies (and hence results that are likely to be missing) (Williamson and Clarke 2012). If a core outcome set for the topic does not exist, users could consider which outcomes are recommended or required for measurement by regulators (for reviews of regulated interventions). It is important to consider the scope of the review question and definition of the outcome domain being synthesized when considering missingness. For example, in a systematic review of the effect of any mass media campaign on any health outcome, if the review outcome domain is broad (e.g. “health behaviours”), then it is likely that all missing studies will have some measure of that domain (and hence eligible results generated). On the other hand, if the review outcome domain is very specific (e.g. tobacco use), it is less likely that all missing studies will have some measure of that domain. In a narrower review of the effect of mass media campaigns designed to help people quit tobacco smoking, it would be reasonable to suspect all missing studies will have measured tobacco use.
13.3.4.2 Funnel plots
Funnel plots have long been used to assess the possibility that results are missing from a meta-analysis in a manner that is related to their magnitude or P value. However, they require careful interpretation (Sterne et al 2011).
A funnel plot is a simple scatter plot of intervention effect estimates from individual studies against a measure of each study’s size or precision. In common with forest plots, it is most common to plot the effect estimates on the horizontal scale, and thus the measure of study size on the vertical axis. This is the opposite of conventional graphical displays for scatter plots, in which the outcome (e.g. intervention effect) is plotted on the vertical axis and the covariate (e.g. study size) is plotted on the horizontal axis.
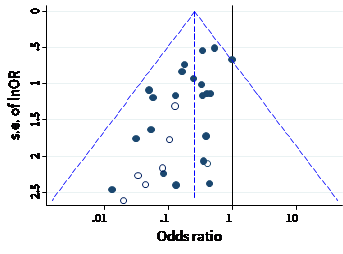
The name ‘funnel plot’ arises from the fact that precision of the estimated intervention effect increases as the size of the study increases. Effect estimates from small studies will therefore typically scatter more widely at the bottom of the graph, with the spread narrowing among larger studies. Ideally, the plot should approximately resemble a symmetrical (inverted) funnel. This is illustrated in Panel A of Figure 13.3.b in which the effect estimates in the larger studies are close to the true intervention odds ratio of 0.4. If there is bias due to missing evidence, for example because smaller studies without statistically significant effects (shown as open circles in Figure 13.3.b, Panel A) remain unpublished, this will lead to an asymmetrical appearance of the funnel plot with a gap at the bottom corner of the graph (Panel B). In this situation the summary estimate calculated in a meta-analysis will tend to over-estimate the intervention effect (Egger et al 1997). The more pronounced the asymmetry, the more likely it is that the amount of bias in the meta-analysis will be substantial.
Figure 13.3.b Hypothetical funnel plots
Panel A: symmetrical plot in the absence of bias due to missing evidence
Panel B: asymmetrical plot in the presence of bias due to missing evidence
Panel C: asymmetrical plot in the presence of bias because some smaller studies (open circles) used unblinded measurement of the outcome and therefore produce exaggerated intervention effect estimates
We recommend that when generating funnel plots, effect estimates be plotted against the standard error of the effect estimate, rather than against the total sample size, on the vertical axis (Sterne and Egger 2001). This is because the statistical power of a trial is determined by factors in addition to sample size, such as the number of participants experiencing the event for dichotomous outcomes, and the standard deviation of responses for continuous outcomes. For example, a study with 100,000 participants and 10 events is less likely to show a statistically significant intervention effect than a study with 1000 participants and 100 events. The standard error summarizes these other factors. Plotting standard errors on a reversed scale places the larger, or most powerful, studies towards the top of the plot. Another advantage of using standard errors is that a simple triangular region can be plotted, within which 95% of studies would be expected to lie in the absence of both biases and heterogeneity. These regions are included in Figure 13.3.b. Funnel plots of effect estimates against their standard errors (on a reversed scale) can be created using RevMan and other statistical software. A triangular 95% confidence region based on a fixed-effect meta-analysis can be included in the plot, and different plotting symbols can be used to allow studies in different subgroups to be identified.
Ratio measures of intervention effect (such as odds ratios and risk ratios) should be plotted on a logarithmic scale. This ensures that effects of the same magnitude but opposite directions (e.g. odds ratios of 0.5 and 2) are equidistant from 1.0. For outcomes measured on a continuous (numerical) scale (e.g. blood pressure, depression score) intervention effects are measured as mean differences or standardized mean differences (SMDs), which should therefore be used as the horizontal axis in funnel plots.
Some authors have argued that visual interpretation of funnel plots is too subjective to be useful. In particular, Terrin and colleagues found that researchers had only a limited ability to identify correctly funnel plots for meta-analyses that were subject to bias due to missing evidence (Terrin et al 2005).
13.3.4.3 Different reasons for funnel plot asymmetry
Although funnel plot asymmetry has long been equated with non-reporting bias (Light and Pillemer 1984, Begg and Berlin 1988), the funnel plot should be seen as a generic means of displaying small-study effects: a tendency for the intervention effects estimated in smaller studies to differ from those estimated in larger studies (Sterne and Egger 2001). Small-study effects may be due to reasons other than non-reporting bias (Egger et al 1997, Sterne et al 2011), some of which are shown in Table 13.3.b.
Table 13.3.b Possible sources of asymmetry in funnel plots. Adapted from (Egger et al 1997)
|
1. Non-reporting biases
|
|
2. Bias in study results leading to spuriously inflated effects in smaller studies
|
|
3. True heterogeneity
|
|
4. Artefactual
|
|
5. Chance |
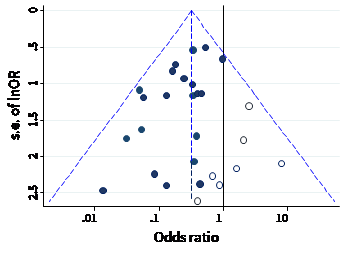
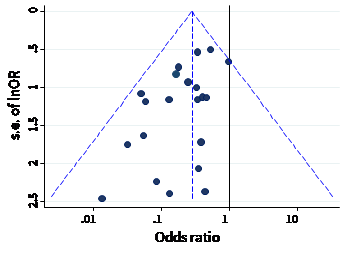
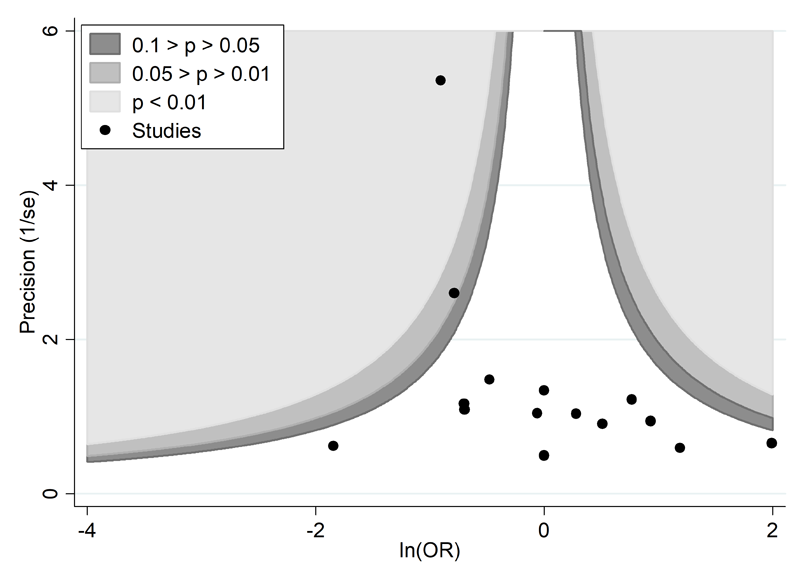
A proposed amendment to the funnel plot is to include contour lines corresponding to perceived ‘milestones’ of statistical significance (P = 0.01, 0.05, 0.1, etc (Peters et al 2008)). This allows the statistical significance of study estimates, and areas in which studies are perceived to be missing, to be considered. Such contour-enhanced funnel plots may help review authors to differentiate asymmetry that is due to non-reporting biases from that due to other factors. For example, if studies appear to be missing in areas where results would be statistically non-significant and unfavourable to the experimental intervention (see Figure 13.3.c, Panel A) then this adds credence to the possibility that the asymmetry is due to non-reporting biases. Conversely, if the supposed missing studies are in areas where results would be statistically significant and favourable to the experimental intervention (see Figure 13.3.c, Panel B), this would suggest the cause of the asymmetry is more likely to be due to factors other than non-reporting biases (see Table 13.3.b).
Figure 13.3.c Contour-enhanced funnel plots
Panel A: there is a suggestion of missing evidence on the right-hand side of the plot, where results would be unfavourable to the experimental intervention and broadly in the area of non-significance (i.e. the white area where P > 0.1), for which non-reporting bias is a plausible explanation.
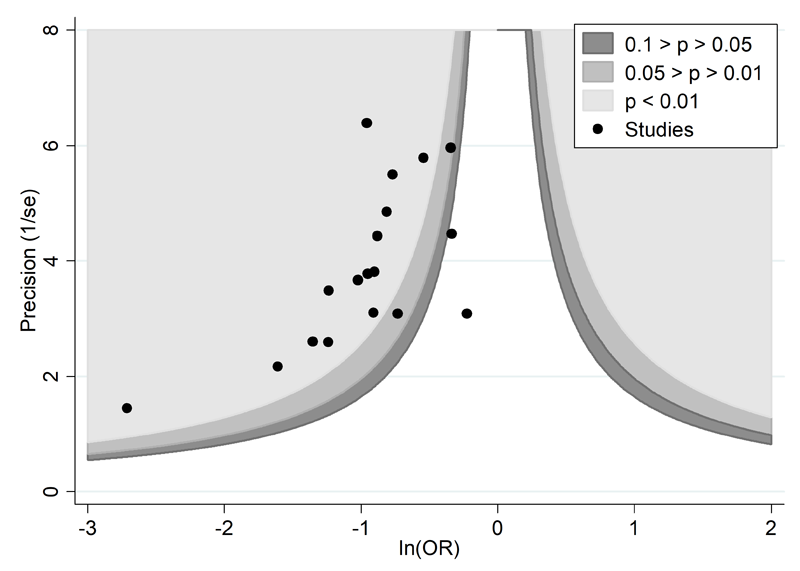
Panel B: there is a suggestion of missing evidence on the bottom left-hand side of the plot. Since most of this area contains regions of high statistical significance (i.e. indicated by light shading) for results that are favourable to the experimental intervention, this reduces the plausibility that non-reporting bias is the underlying cause of this funnel plot asymmetry.
13.3.4.4 Tests for funnel plot asymmetry
Tests for funnel plot asymmetry (small-study effects) examine whether the association between estimated intervention effects and a measure of study size is greater than expected to occur by chance (Sterne et al 2011). Several tests are available, the first and most well-known of which is the Egger test (Egger et al 1997). The tests typically have low power, which means that non-reporting biases cannot generally be excluded, and in practice they do not always lead to the same conclusions about the presence of small-study effects (Lin et al 2018).
After reviewing the results of simulation studies evaluating test characteristics, and based on theoretical considerations, Sterne and colleagues (Sterne et al 2011) made the following recommendations.
- As a rule of thumb, tests for funnel plot asymmetry should be used only when there are at least 10 studies included in the meta-analysis, because when there are fewer studies the power of the tests is low. Only 28% of a random sample of 300 systematic reviews indexed in 2020 included a meta-analysis with at least 10 studies (Nguyen et al 2022), which implies that tests for funnel plot asymmetry are likely to be applicable in a minority of meta-analyses.
- Tests should not be used if studies are of similar size (similar standard errors of intervention effect estimates).
- Results of tests for funnel plot asymmetry should be interpreted in the light of visual inspection of the funnel plot (see Sections 13.3.4.2 and 13.3.4.3). Examining a contour-enhanced funnel plot may further aid interpretation (see Figure 13.3.c).
- When there is evidence of funnel plot asymmetry from a test, non-reporting biases should be considered as one of several possible explanations, and review authors should attempt to distinguish the different possible reasons for it (see Table 13.3.b).
Sterne and colleagues provided more detailed suggestions specific to intervention effects measured as mean differences, SMDs, odds ratios, risk ratios and risk differences (Sterne et al 2011). Some tests, including the original Egger test, are not recommended for application to odds ratios and SMDs because of artefactual correlations between the effect size and its standard error (Sterne et al 2011, Zwetsloot et al 2017). For odds ratios, methods proposed by Harbord and colleagues and Peters and colleagues overcome this problem (Harbord et al 2006, Peters et al 2006).
None of the recommended tests for funnel plot asymmetry is implemented in RevMan; Jin and colleagues describe other software available to implement them (Jin et al 2015).
13.3.4.5 Interpreting funnel plots: summary
To summarize, funnel plot asymmetry should not be considered to be diagnostic for the presence of non-reporting bias. Tests for funnel plot asymmetry are applicable only in the minority of meta-analyses for which their use is appropriate. If there is evidence of funnel plot asymmetry then review authors should attempt to distinguish the different possible reasons for it listed in Table 13.3.b. For example, considering the particular intervention, and the circumstances in which it was implemented in different studies can help identify true heterogeneity as a cause of funnel plot asymmetry. Nevertheless, a concern remains that visual interpretation of funnel plots is inherently subjective.
13.3.4.6 Sensitivity analyses
When review authors are concerned that small-study effects are influencing the results of a meta-analysis, they may want to conduct sensitivity analyses to explore the robustness of the meta-analysis conclusions to different assumptions about the causes of funnel plot asymmetry. The following approaches have been suggested. Ideally, these should be pre-specified.
Comparing fixed-effect and random-effects estimates
In the presence of heterogeneity, a random-effects meta-analysis weights the studies relatively more equally than a fixed-effect analysis (see Chapter 10, Section 10.10.4.1). It follows that in the presence of small-study effects, in which the intervention effect is systematically different in the smaller compared with the larger studies, the random-effects estimate of the intervention effect will shift towards the results of the smaller studies. We recommend that when review authors are concerned about the influence of small-study effects on the results of a meta-analysis in which there is evidence of between-study heterogeneity (I2 > 0), they compare the fixed-effect and random-effects estimates of the intervention effect. If the estimates are similar, then any small-study effects have little effect on the intervention effect estimate. If the random-effects estimate has shifted towards the results of the smaller studies, review authors should consider whether it is reasonable to conclude that the intervention was genuinely different in the smaller studies, or if results of smaller studies were disseminated selectively. Formal investigations of heterogeneity may reveal other explanations for funnel plot asymmetry, in which case presentation of results should focus on these. If the larger studies tend to be those conducted with more methodological rigour, or conducted in circumstances more typical of the use of the intervention in practice, then review authors should consider reporting the results of meta-analyses restricted to the larger, more rigorous studies.
Selection models
Selection models were developed to estimate intervention effects ‘corrected’ for bias due to missing results (McShane et al 2016). The methods are based on the assumption that the size, direction and P value of study results and the size of studies influences the probability of their publication. For example, Copas proposed a model in which the probability that a study is included in a meta-analysis depends on its standard error. Since it is not possible to estimate all model parameters precisely, he advocates sensitivity analyses in which the intervention effect is estimated under a range of assumptions about the severity of the selection bias (Copas 1999). These analyses show how the estimated intervention effect (and confidence interval) changes as the assumed amount of selection bias increases. If the estimates are relatively stable regardless of the selection model assumed, this suggests that the unadjusted estimate is unlikely to be influenced by non-reporting biases. On the other hand, if the estimates vary considerably depending on the selection model assumed, this suggests that non-reporting biases may well drive the unadjusted estimate (McShane et al 2016).
A major problem with selection models is that they assume that mechanisms leading to small-study effects other than non-reporting biases (see Table 13.3.b) are not operating, and may give misleading results if this assumption is not correct. Jin and colleagues summarize the advantages and disadvantages of eight selection models, indicate circumstances in which each can be used, and describe software available to implement them (Jin et al 2015). Given the complexity of the models, consultation with a statistician is recommended for their implementation.
Regression-based methods
Moreno and colleagues propose an approach, based on tests for funnel plot asymmetry, in which a regression line to the funnel plot is extrapolated to estimate the effect of intervention in a very large study (Moreno et al 2009). They regress effect size on within-study variance, and incorporate heterogeneity as a multiplicative rather than additive component (Moreno et al 2012). This approach gives more weight to the larger studies than in either a standard fixed-effect or random-effects meta-analysis, so that the adjusted estimate will be closer to the effects observed in the larger studies. Rücker and colleagues combine a similar approach with a shrinkage procedure (Rücker et al 2011a, Rücker et al 2011b). The underlying model is an extended random-effects model, with an additional parameter representing the bias introduced by small-study effects.
In common with tests for funnel plot asymmetry, regression-based methods to estimate the effect of intervention in a large study should be used only when there are sufficient studies (at least 10) to allow appropriate estimation of the regression line. When all the studies are small, extrapolation to an infinitely sized study may produce effect estimates that are more extreme than any of the existing studies, and if the approach is used in such a situation it might be more appropriate to extrapolate only as far as the largest observed study.
13.3.5 Reaching an overall judgement about risk of bias due to missing evidence
We have described several approaches review authors can use to assess the risk of bias in a meta-analysis when entire studies or particular results within studies are missing selectively. These include comparison of protocols with published reports to detect selective non-reporting of results (Section 13.3.1.3), consideration of circumstances suggesting not all studies were identified (Section 13.3.1.4), and the use of funnel plots to identify small-study effects, for which non-reporting bias is one cause (Section 13.3.4.3).
The ROB-ME tool prompts review authors to consider the findings of each approach when reaching an overall judgement about the risk of bias due to missing evidence in a specific meta-analysis result. The tool includes an algorithm that maps responses to signalling questions onto a proposed risk of bias judgement. Possible risk of bias judgements are:
- low risk of bias: the meta-analysis result is unlikely to be biased due to missing evidence;
- high risk of bias: the meta-analysis result is likely to be biased due to missing evidence;
- some concerns: uncertainties about the extent or potential impact of missing evidence exist that preclude a judgement of low or high risk of bias.
For example, selective non-reporting of results may not have been detected in any of the studies identified. However, if a contour-enhanced funnel plot and sensitivity analysis suggests results are missing systematically, then it would be reasonable to conclude that the meta-analysis result is at high risk of bias due to missing evidence. On the other hand, if the systematic review is based on an inception cohort, such that all studies that have been conducted are known, and these studies were fully reported in line with their analysis plans, then there would be low risk of bias due to missing evidence in a meta-analysis result. Indeed, such a low risk of bias judgement would carry even in the presence of asymmetry in a funnel plot; although it would be important to investigate the reason for this asymmetry (e.g. it might be due to systematic differences in the PICOs of smaller and larger studies, or to problems in the methodological conduct of the smaller studies).
13.4 Summary
There is clear evidence that selective dissemination of study reports and results leads to an over-estimate of the benefits and under-estimate of the harms of interventions in systematic reviews and meta-analyses. However, overcoming, detecting and correcting for bias due to missing evidence is difficult. Comprehensive searches are important, but are not on their own sufficient to prevent substantial potential biases. Review authors should therefore consider the risk of bias due to missing evidence in meta-analysis included in their review (see MECIR Box 13.4.a).
We have presented a tool for assessing risk of bias due to missing evidence in a meta-analysis. Of the approaches described in the tool, a thorough assessment of selective non-reporting or under-reporting of results in the studies identified (Section 13.3.3) is likely to be the most labour intensive, yet the most valuable. Because the number of identified studies with results missing for a given meta-analysis is known, the impact of selective non-reporting or under-reporting of results can be quantified more easily (see Section 13.3.4) than the impact of selective non-publication of an unknown number of studies.
The value of the other methods described in the tool will depend on the circumstances of the review. For example, if review authors suspect that a meta-analysis is biased because results were missing selectively from a large proportion of the studies identified, then the graphical and statistical methods outlined in Section 13.3.4 (e.g. funnel plots) are unlikely to change their judgement. However, funnel plots, tests for funnel plot asymmetry and other sensitivity analyses may be useful in cases where protocols or records from trials registers were unavailable for most studies, making it difficult to assess selective non-reporting or under-reporting of results reliably. When there is evidence of funnel plot asymmetry, non-reporting biases should be considered as only one of a number of possible explanations: review authors should attempt to understand the sources of the asymmetry, and consider their implications in the light of any qualitative signals that raise a suspicion of additional missing studies, and other sensitivity analyses.
MECIR Box 13.4.a Relevant expectations for conduct of intervention reviews
|
C73: Investigating risk of bias due to missing results (Highly desirable) |
|
|
Consider the potential impact of non-reporting biases on the results of the review or the meta-analysis it contains. |
There is overwhelming evidence of non-reporting biases of various types. These can be addressed at various points of the review. A thorough search, and attempts to obtain unpublished results, might minimize the risk. Analyses of the results of included studies, for example using funnel plots, can sometimes help determine the possible extent of the problem, as can attempts to identify study protocols, which should be a routine feature of Cochrane Reviews. |
13.5 Chapter information
Authors: Matthew J Page, Julian PT Higgins, Jonathan AC Sterne
Acknowledgments: We thank Douglas Altman, Isabelle Boutron, James Carpenter, Matthias Egger, Roger Harbord, David Jones, David Moher, Alex Sutton, Jennifer Tetzlaff and Lucy Turner for their contributions to previous versions of this chapter. We thank Lisa Bero, Isabelle Boutron, Adam Dunn, Kerry Dwan, Roy Elbers, Asbjørn Hróbjartsson, Raju Kanukula, Jamie Kirkham, Tianjing Li, Andreas Lundh, Evan Mayo-Wilson, Joanne McKenzie, Joerg Meerpohl, Lesley Stewart, Alex Sutton and Erick Turner for their contributions to the tool for assessing risk of bias due to missing evidence in a meta-analysis. We thank Evan Mayo-Wilson for his helpful comments on this chapter.
Funding: MJP was supported by an Australian National Health and Medical Research Council (NHMRC) Early Career Fellowship (1088535) during the drafting of this chapter. JPTH and JACS received funding from Cochrane, UK Medical Research Council grant MR/M025209/1 and UK National Institute for Health Research Senior Investigator awards NF-SI-0617-10145 and NF-SI-0611-10168, respectively. The views expressed are those of the author(s) and not necessarily those of the NHMRC, NHS, the NIHR or the Department of Health.
Declarations of interest: Jonathan Sterne is an author on papers proposing tests for funnel plot asymmetry.
13.6 References
Alqaidoom Z, Nguyen P, Awadh M, Page M. Impact of searching clinical trials registers in systematic reviews of pharmaceutical and non-pharmaceutical interventions: Reanalysis of meta-analyses. Research Synthesis Methods 2023; 14: 52-67.
DeVito NJ, Bacon S, Goldacre B. FDAAA TrialsTracker: A live informatics tool to monitor compliance with FDA requirements to report clinical trial results 2018. https://www.biorxiv.org/content/biorxiv/early/2018/02/16/266452.full.pdf.
Schroll JB, Penninga EI, Gøtzsche PC. Assessment of Adverse Events in Protocols, Clinical Study Reports, and Published Papers of Trials of Orlistat: A Document Analysis. PLoS Med 2016; 13: e1002101.