Holger J Schünemann, Gunn E Vist, Julian PT Higgins, Nancy Santesso, Jonathan J Deeks, Paul Glasziou, Elie A Akl, Gordon H Guyatt; on behalf of the Cochrane GRADEing Methods Group
Key Points:
- This chapter provides guidance on interpreting the results of synthesis in order to communicate the conclusions of the review effectively.
- Methods are presented for computing, presenting and interpreting relative and absolute effects for dichotomous outcome data, including the number needed to treat (NNT).
- For continuous outcome measures, review authors can present summary results for studies using natural units of measurement or as minimal important differences when all studies use the same scale. When studies measure the same construct but with different scales, review authors will need to find a way to interpret the standardized mean difference, or to use an alternative effect measure for the meta-analysis such as the ratio of means.
- Review authors should not describe results as ‘statistically significant’, ‘not statistically significant’ or ‘non-significant’ or unduly rely on thresholds for P values, but report the confidence interval together with the exact P value.
- Review authors should not make recommendations about healthcare decisions, but they can – after describing the certainty of evidence and the balance of benefits and harms – highlight different actions that might be consistent with particular patterns of values and preferences and other factors that determine a decision such as cost.
Cite this chapter as: Schünemann HJ, Vist GE, Higgins JPT, Santesso N, Deeks JJ, Glasziou P, Akl EA, Guyatt GH. Chapter 15: Interpreting results and drawing conclusions [last updated August 2023]. In: Higgins JPT, Thomas J, Chandler J, Cumpston M, Li T, Page MJ, Welch VA (editors). Cochrane Handbook for Systematic Reviews of Interventions version 6.5. Cochrane, 2024. Available from cochrane.org/handbook.
15.1 Introduction
The purpose of Cochrane Reviews is to facilitate healthcare decisions by patients and the general public, clinicians, guideline developers, administrators and policy makers. They also inform future research. A clear statement of findings, a considered discussion and a clear presentation of the authors’ conclusions are, therefore, important parts of the review. In particular, the following issues can help people make better informed decisions and increase the usability of Cochrane Reviews:
- information on all important outcomes, including adverse outcomes;
- the certainty of the evidence for each of these outcomes, as it applies to specific populations and specific interventions; and
- clarification of the manner in which particular values and preferences may bear on the desirable and undesirable consequences of the intervention.
A ‘Summary of findings’ table, described in Chapter 14, Section 14.1, provides key pieces of information about health benefits and harms in a quick and accessible format. It is highly desirable that review authors include a ‘Summary of findings’ table in Cochrane Reviews alongside a sufficient description of the studies and meta-analyses to support its contents. This description includes the rating of the certainty of evidence, also called the quality of the evidence or confidence in the estimates of the effects, which is expected in all Cochrane Reviews.
‘Summary of findings’ tables are usually supported by full evidence profiles which include the detailed ratings of the evidence (Guyatt et al 2011a, Guyatt et al 2013a, Guyatt et al 2013b, Santesso et al 2016). The Discussion section of the text of the review provides space to reflect and consider the implications of these aspects of the review’s findings. Cochrane Reviews include five standard subheadings to ensure the Discussion section places the review in an appropriate context: ‘Summary of main results (benefits and harms)’; ‘Potential biases in the review process’; ‘Overall completeness and applicability of evidence’; ‘Certainty of the evidence’; and ‘Agreements and disagreements with other studies or reviews’. Following the Discussion, the Authors’ conclusions section is divided into two standard subsections: ‘Implications for practice’ and ‘Implications for research’. The assessment of the certainty of evidence facilitates a structured description of the implications for practice and research.
Because Cochrane Reviews have an international audience, the Discussion and Authors’ conclusions should, so far as possible, assume a broad international perspective and provide guidance for how the results could be applied in different settings, rather than being restricted to specific national or local circumstances. Cultural differences and economic differences may both play an important role in determining the best course of action based on the results of a Cochrane Review. Furthermore, individuals within societies have widely varying values and preferences regarding health states, and use of societal resources to achieve particular health states. For all these reasons, and because information that goes beyond that included in a Cochrane Review is required to make fully informed decisions, different people will often make different decisions based on the same evidence presented in a review.
Thus, review authors should avoid specific recommendations that inevitably depend on assumptions about available resources, values and preferences, and other factors such as equity considerations, feasibility and acceptability of an intervention. The purpose of the review should be to present information and aid interpretation rather than to offer recommendations. The discussion and conclusions should help people understand the implications of the evidence in relation to practical decisions and apply the results to their specific situation. Review authors can aid this understanding of the implications by laying out different scenarios that describe certain value structures.
In this chapter, we address first one of the key aspects of interpreting findings that is also fundamental in completing a ‘Summary of findings’ table: the certainty of evidence related to each of the outcomes. We then provide a more detailed consideration of issues around applicability and around interpretation of numerical results, and provide suggestions for presenting authors’ conclusions.
15.2 Issues of indirectness and applicability
15.2.1 The role of the review author
“A leap of faith is always required when applying any study findings to the population at large” or to a specific person. “In making that jump, one must always strike a balance between making justifiable broad generalizations and being too conservative in one’s conclusions” (Friedman et al 1985). In addition to issues about risk of bias and other domains determining the certainty of evidence, this leap of faith is related to how well the identified body of evidence matches the posed PICO (Population, Intervention, Comparator(s) and Outcome) question. As to the population, no individual can be entirely matched to the population included in research studies. At the time of decision, there will always be differences between the study population and the person or population to whom the evidence is applied; sometimes these differences are slight, sometimes large.
The terms applicability, generalizability, external validity and transferability are related, sometimes used interchangeably and have in common that they lack a clear and consistent definition in the classic epidemiological literature (Schünemann et al 2013). However, all of the terms describe one overarching theme: whether or not available research evidence can be directly used to answer the health and healthcare question at hand, ideally supported by a judgement about the degree of confidence in this use (Schünemann et al 2013). GRADE’s certainty domains include a judgement about ‘indirectness’ to describe all of these aspects including the concept of direct versus indirect comparisons of different interventions (Atkins et al 2004, Guyatt et al 2008, Guyatt et al 2011b).
To address adequately the extent to which a review is relevant for the purpose to which it is being put, there are certain things the review author must do, and certain things the user of the review must do to assess the degree of indirectness. Cochrane and the GRADE Working Group suggest using a very structured framework to address indirectness. We discuss here and in Chapter 14 what the review author can do to help the user. Cochrane Review authors must be extremely clear on the population, intervention and outcomes that they intend to address. Chapter 14, Section 14.1.2, also emphasizes a crucial step: the specification of all patient-important outcomes relevant to the intervention strategies under comparison.
In considering whether the effect of an intervention applies equally to all participants, and whether different variations on the intervention have similar effects, review authors need to make a priori hypotheses about possible effect modifiers, and then examine those hypotheses (see Chapter 10, Section 10.10 and Section 10.11). If they find apparent subgroup effects, they must ultimately decide whether or not these effects are credible (Sun et al 2012). Differences between subgroups, particularly those that correspond to differences between studies, should be interpreted cautiously. Some chance variation between subgroups is inevitable so, unless there is good reason to believe that there is an interaction, review authors should not assume that the subgroup effect exists. If, despite due caution, review authors judge subgroup effects in terms of relative effect estimates as credible (i.e. the effects differ credibly), they should conduct separate meta-analyses for the relevant subgroups, and produce separate ‘Summary of findings’ tables for those subgroups.
The user of the review will be challenged with ‘individualization’ of the findings, whether they seek to apply the findings to an individual patient or a policy decision in a specific context. For example, even if relative effects are similar across subgroups, absolute effects will differ according to baseline risk. Review authors can help provide this information by identifying identifiable groups of people with varying baseline risks in the ‘Summary of findings’ tables, as discussed in Chapter 14, Section 14.1.3. Users can then identify their specific case or population as belonging to a particular risk group, if relevant, and assess their likely magnitude of benefit or harm accordingly. A description of the identifying prognostic or baseline risk factors in a brief scenario (e.g. age or gender) will help users of a review further.
Another decision users must make is whether their individual case or population of interest is so different from those included in the studies that they cannot use the results of the systematic review and meta-analysis at all. Rather than rigidly applying the inclusion and exclusion criteria of studies, it is better to ask whether or not there are compelling reasons why the evidence should not be applied to a particular patient. Review authors can sometimes help decision makers by identifying important variation where divergence might limit the applicability of results (Rothwell 2005, Schünemann et al 2006, Guyatt et al 2011b, Schünemann et al 2013), including biologic and cultural variation, and variation in adherence to an intervention.
In addressing these issues, review authors cannot be aware of, or address, the myriad of differences in circumstances around the world. They can, however, address differences of known importance to many people and, importantly, they should avoid assuming that other people’s circumstances are the same as their own in discussing the results and drawing conclusions.
15.2.2 Biological variation
Issues of biological variation that may affect the applicability of a result to a reader or population include divergence in pathophysiology (e.g. biological differences between women and men that may affect responsiveness to an intervention) and divergence in a causative agent (e.g. for infectious diseases such as malaria, which may be caused by several different parasites). The discussion of the results in the review should make clear whether the included studies addressed all or only some of these groups, and whether any important subgroup effects were found.
15.2.3 Variation in context
Some interventions, particularly non-pharmacological interventions, may work in some contexts but not in others; the situation has been described as program by context interaction (Hawe et al 2004). Contextual factors might pertain to the host organization in which an intervention is offered, such as the expertise, experience and morale of the staff expected to carry out the intervention, the competing priorities for the clinician’s or staff’s attention, the local resources such as service and facilities made available to the program and the status or importance given to the program by the host organization. Broader context issues might include aspects of the system within which the host organization operates, such as the fee or payment structure for healthcare providers and the local insurance system. Some interventions, in particular complex interventions (see Chapter 17), can be only partially implemented in some contexts, and this requires judgements about indirectness of the intervention and its components for readers in that context (Schünemann 2013).
Contextual factors may also pertain to the characteristics of the target group or population, such as cultural and linguistic diversity, socio-economic position, rural/urban setting. These factors may mean that a particular style of care or relationship evolves between service providers and consumers that may or may not match the values and technology of the program.
For many years these aspects have been acknowledged when decision makers have argued that results of evidence reviews from other countries do not apply in their own country or setting. Whilst some programmes/interventions have been successfully transferred from one context to another, others have not (Resnicow et al 1993, Lumley et al 2004, Coleman et al 2015). Review authors should be cautious when making generalizations from one context to another. They should report on the presence (or otherwise) of context-related information in intervention studies, where this information is available.
15.2.4 Variation in adherence
Variation in the adherence of the recipients and providers of care can limit the certainty in the applicability of results. Predictable differences in adherence can be due to divergence in how recipients of care perceive the intervention (e.g. the importance of side effects), economic conditions or attitudes that make some forms of care inaccessible in some settings, such as in low-income countries (Dans et al 2007). It should not be assumed that high levels of adherence in closely monitored randomized trials will translate into similar levels of adherence in normal practice.
15.2.5 Variation in values and preferences
Decisions about healthcare management strategies and options involve trading off health benefits and harms. The right choice may differ for people with different values and preferences (i.e. the importance people place on the outcomes and interventions), and it is important that decision makers ensure that decisions are consistent with a patient or population’s values and preferences. The importance placed on outcomes, together with other factors, will influence whether the recipients of care will or will not accept an option that is offered (Alonso-Coello et al 2016) and, thus, can be one factor influencing adherence. In Section 15.6, we describe how the review author can help this process and the limits of supporting decision making based on intervention reviews.
15.3 Interpreting results of statistical analyses
15.3.1 Confidence intervals
Results for both individual studies and meta-analyses are reported with a point estimate together with an associated confidence interval. For example, ‘The odds ratio was 0.75 with a 95% confidence interval of 0.70 to 0.80’. The point estimate (0.75) is the best estimate of the magnitude and direction of the experimental intervention’s effect compared with the comparator intervention. The confidence interval describes the uncertainty inherent in any estimate, and describes a range of values within which we can be reasonably sure that the true effect actually lies. If the confidence interval is relatively narrow (e.g. 0.70 to 0.80), the effect size is known precisely. If the interval is wider (e.g. 0.60 to 0.93) the uncertainty is greater, although there may still be enough precision to make decisions about the utility of the intervention. Intervals that are very wide (e.g. 0.50 to 1.10) indicate that we have little knowledge about the effect and this imprecision affects our certainty in the evidence, and that further information would be needed before we could draw a more certain conclusion.
A 95% confidence interval is often interpreted as indicating a range within which we can be 95% certain that the true effect lies. This statement is a loose interpretation, but is useful as a rough guide. The strictly correct interpretation of a confidence interval is based on the hypothetical notion of considering the results that would be obtained if the study were repeated many times. If a study were repeated infinitely often, and on each occasion a 95% confidence interval calculated, then 95% of these intervals would contain the true effect (see Section 15.3.3 for further explanation).
The width of the confidence interval for an individual study depends to a large extent on the sample size. Larger studies tend to give more precise estimates of effects (and hence have narrower confidence intervals) than smaller studies. For continuous outcomes, precision depends also on the variability in the outcome measurements (i.e. how widely individual results vary between people in the study, measured as the standard deviation); for dichotomous outcomes it depends on the risk of the event (more frequent events allow more precision, and narrower confidence intervals), and for time-to-event outcomes it also depends on the number of events observed. All these quantities are used in computation of the standard errors of effect estimates from which the confidence interval is derived.
The width of a confidence interval for a meta-analysis depends on the precision of the individual study estimates and on the number of studies combined. In addition, for random-effects models, precision will decrease with increasing heterogeneity and confidence intervals will widen correspondingly (see Chapter 10, Section 10.10.4). As more studies are added to a meta-analysis the width of the confidence interval usually decreases. However, if the additional studies increase the heterogeneity in the meta-analysis and a random-effects model is used, it is possible that the confidence interval width will increase.
Confidence intervals and point estimates have different interpretations in fixed-effect and random-effects models. While the fixed-effect estimate and its confidence interval address the question ‘what is the best (single) estimate of the effect?’, the random-effects estimate assumes there to be a distribution of effects, and the estimate and its confidence interval address the question ‘what is the best estimate of the average effect?’ A confidence interval may be reported for any level of confidence (although they are most commonly reported for 95%, and sometimes 90% or 99%). For example, the odds ratio of 0.80 could be reported with an 80% confidence interval of 0.73 to 0.88; a 90% interval of 0.72 to 0.89; and a 95% interval of 0.70 to 0.92. As the confidence level increases, the confidence interval widens.
There is logical correspondence between the confidence interval and the P value (see Section 15.3.3). The 95% confidence interval for an effect will exclude the null value (such as an odds ratio of 1.0 or a risk difference of 0) if and only if the test of significance yields a P value of less than 0.05. If the P value is exactly 0.05, then either the upper or lower limit of the 95% confidence interval will be at the null value. Similarly, the 99% confidence interval will exclude the null if and only if the test of significance yields a P value of less than 0.01.
Together, the point estimate and confidence interval provide information to assess the effects of the intervention on the outcome. For example, suppose that we are evaluating an intervention that reduces the risk of an event and we decide that it would be useful only if it reduced the risk of an event from 30% by at least 5 percentage points to 25% (these values will depend on the specific clinical scenario and outcomes, including the anticipated harms). If the meta-analysis yielded an effect estimate of a reduction of 10 percentage points with a tight 95% confidence interval, say, from 7% to 13%, we would be able to conclude that the intervention was useful since both the point estimate and the entire range of the interval exceed our criterion of a reduction of 5% for net health benefit. However, if the meta-analysis reported the same risk reduction of 10% but with a wider interval, say, from 2% to 18%, although we would still conclude that our best estimate of the intervention effect is that it provides net benefit, we could not be so confident as we still entertain the possibility that the effect could be between 2% and 5%. If the confidence interval was wider still, and included the null value of a difference of 0%, we would still consider the possibility that the intervention has no effect on the outcome whatsoever, and would need to be even more sceptical in our conclusions.
Review authors may use the same general approach to conclude that an intervention is not useful. Continuing with the above example where the criterion for an important difference that should be achieved to provide more benefit than harm is a 5% risk difference, an effect estimate of 2% with a 95% confidence interval of 1% to 4% suggests that the intervention does not provide net health benefit.
15.3.2 P values and statistical significance
A P value is the standard result of a statistical test, and is the probability of obtaining the observed effect (or larger) under a ‘null hypothesis’. In the context of Cochrane Reviews there are two commonly used statistical tests. The first is a test of overall effect (a Z-test), and its null hypothesis is that there is no overall effect of the experimental intervention compared with the comparator on the outcome of interest. The second is the (Chi2) test for heterogeneity, and its null hypothesis is that there are no differences in the intervention effects across studies.
A P value that is very small indicates that the observed effect is very unlikely to have arisen purely by chance, and therefore provides evidence against the null hypothesis. It has been common practice to interpret a P value by examining whether it is smaller than particular threshold values. In particular, P values less than 0.05 are often reported as ‘statistically significant’, and interpreted as being small enough to justify rejection of the null hypothesis. However, the 0.05 threshold is an arbitrary one that became commonly used in medical and psychological research largely because P values were determined by comparing the test statistic against tabulations of specific percentage points of statistical distributions. If review authors decide to present a P value with the results of a meta-analysis, they should report a precise P value (as calculated by most statistical software), together with the 95% confidence interval. Review authors should not describe results as ‘statistically significant’, ‘not statistically significant’ or ‘non-significant’ or unduly rely on thresholds for P values, but report the confidence interval together with the exact P value (see MECIR Box 15.3.a).
We discuss interpretation of the test for heterogeneity in Chapter 10, Section 10.10.2; the remainder of this section refers mainly to tests for an overall effect. For tests of an overall effect, the computation of P involves both the effect estimate and precision of the effect estimate (driven largely by sample size). As precision increases, the range of plausible effects that could occur by chance is reduced. Correspondingly, the statistical significance of an effect of a particular magnitude will usually be greater (the P value will be smaller) in a larger study than in a smaller study.
P values are commonly misinterpreted in two ways. First, a moderate or large P value (e.g. greater than 0.05) may be misinterpreted as evidence that the intervention has no effect on the outcome. There is an important difference between this statement and the correct interpretation that there is a high probability that the observed effect on the outcome is due to chance alone. To avoid such a misinterpretation, review authors should always examine the effect estimate and its 95% confidence interval.
The second misinterpretation is to assume that a result with a small P value for the summary effect estimate implies that an experimental intervention has an important benefit. Such a misinterpretation is more likely to occur in large studies and meta-analyses that accumulate data over dozens of studies and thousands of participants. The P value addresses the question of whether the experimental intervention effect is precisely nil; it does not examine whether the effect is of a magnitude of importance to potential recipients of the intervention. In a large study, a small P value may represent the detection of a trivial effect that may not lead to net health benefit when compared with the potential harms (i.e. harmful effects on other important outcomes). Again, inspection of the point estimate and confidence interval helps correct interpretations (see Section 15.3.1).
MECIR Box 15.3.a Relevant expectations for conduct of intervention reviews
|
C72: Interpreting results (Mandatory) |
|
|
Focus interpretation of results on estimates of effect and their confidence intervals, avoiding use of a distinction between “statistically significant” and “statistically non-significant". |
Authors commonly mistake a lack of evidence of effect as evidence of a lack of effect. |
15.3.3 Relation between confidence intervals, statistical significance and certainty of evidence
The confidence interval (and imprecision) is only one domain that influences overall uncertainty about effect estimates. Uncertainty resulting from imprecision (i.e. statistical uncertainty) may be no less important than uncertainty from indirectness, or any other GRADE domain, in the context of decision making (Schünemann 2016). Thus, the extent to which interpretations of the confidence interval described in Sections 15.3.1 and 15.3.2 correspond to conclusions about overall certainty of the evidence for the outcome of interest depends on these other domains. If there are no concerns about other domains that determine the certainty of the evidence (i.e. risk of bias, inconsistency, indirectness or publication bias), then the interpretation in Sections 15.3.1 and 15.3.2. about the relation of the confidence interval to the true effect may be carried forward to the overall certainty. However, if there are concerns about the other domains that affect the certainty of the evidence, the interpretation about the true effect needs to be seen in the context of further uncertainty resulting from those concerns.
For example, nine randomized controlled trials in almost 6000 cancer patients indicated that the administration of heparin reduces the risk of venous thromboembolism (VTE), with a risk ratio of 43% (95% CI 19% to 60%) (Akl et al 2011a). For patients with a plausible baseline risk of approximately 4.6% per year, this relative effect suggests that heparin leads to an absolute risk reduction of 20 fewer VTEs (95% CI 9 fewer to 27 fewer) per 1000 people per year (Akl et al 2011a). Now consider that the review authors or those applying the evidence in a guideline have lowered the certainty in the evidence as a result of indirectness. While the confidence intervals would remain unchanged, the certainty in that confidence interval and in the point estimate as reflecting the truth for the question of interest will be lowered. In fact, the certainty range will have unknown width so there will be unknown likelihood of a result within that range because of this indirectness. The lower the certainty in the evidence, the less we know about the width of the certainty range, although methods for quantifying risk of bias and understanding potential direction of bias may offer insight when lowered certainty is due to risk of bias. Nevertheless, decision makers must consider this uncertainty, and must do so in relation to the effect measure that is being evaluated (e.g. a relative or absolute measure). We will describe the impact on interpretations for dichotomous outcomes in Section 15.4.
15.4 Interpreting results from dichotomous outcomes (including numbers needed to treat)
15.4.1 Relative and absolute risk reductions
Clinicians may be more inclined to prescribe an intervention that reduces the relative risk of death by 25% than one that reduces the risk of death by 1 percentage point, although both presentations of the evidence may relate to the same benefit (i.e. a reduction in risk from 4% to 3%). The former refers to the relative reduction in risk and the latter to the absolute reduction in risk. As described in Chapter 6, Section 6.4.1, there are several measures for comparing dichotomous outcomes in two groups. Meta-analyses are usually undertaken using risk ratios (RR), odds ratios (OR) or risk differences (RD), but there are several alternative ways of expressing results.
Relative risk reduction (RRR) is a convenient way of re-expressing a risk ratio as a percentage reduction:

For example, a risk ratio of 0.75 translates to a relative risk reduction of 25%, as in the example above.
The risk difference is often referred to as the absolute risk reduction (ARR) or absolute risk increase (ARI), and may be presented as a percentage (e.g. 1%), as a decimal (e.g. 0.01), or as account (e.g. 10 out of 1000). We consider different choices for presenting absolute effects in Section 15.4.3. We then describe computations for obtaining these numbers from the results of individual studies and of meta-analyses in Section 15.4.4.
15.4.2 Number needed to treat (NNT)
The number needed to treat (NNT) is a common alternative way of presenting information on the effect of an intervention. The NNT is defined as the expected number of people who need to receive the experimental rather than the comparator intervention for one additional person to either incur or avoid an event (depending on the direction of the result) in a given time frame. Thus, for example, an NNT of 10 can be interpreted as ‘it is expected that one additional (or less) person will incur an event for every 10 participants receiving the experimental intervention rather than comparator over a given time frame’. It is important to be clear that:
- since the NNT is derived from the risk difference, it is still a comparative measure of effect (experimental versus a specific comparator) and not a general property of a single intervention; and
- the NNT gives an ‘expected value’. For example, NNT = 10 does not imply that one additional event will occur in each and every group of 10 people.
NNTs can be computed for both beneficial and detrimental events, and for interventions that cause both improvements and deteriorations in outcomes. In all instances NNTs are expressed as positive whole numbers. Some authors use the term ‘number needed to harm’ (NNH) when an intervention leads to an adverse outcome, or a decrease in a positive outcome, rather than improvement. However, this phrase can be misleading (most notably, it can easily be read to imply the number of people who will experience a harmful outcome if given the intervention), and it is strongly recommended that ‘number needed to harm’ and ‘NNH’ are avoided. The preferred alternative is to use phrases such as ‘number needed to treat for an additional beneficial outcome’ (NNTB) and ‘number needed to treat for an additional harmful outcome’ (NNTH) to indicate direction of effect.
As NNTs refer to events, their interpretation needs to be worded carefully when the binary outcome is a dichotomization of a scale-based outcome. For example, if the outcome is pain measured on a ‘none, mild, moderate or severe’ scale it may have been dichotomized as ‘none or mild’ versus ‘moderate or severe’. It would be inappropriate for an NNT from these data to be referred to as an ‘NNT for pain’. It is an ‘NNT for moderate or severe pain’.
We consider different choices for presenting absolute effects in Section 15.4.3. We then describe computations for obtaining these numbers from the results of individual studies and of meta-analyses in Section 15.4.4.
15.4.3 Expressing risk differences
Users of reviews are liable to be influenced by the choice of statistical presentations of the evidence. Hoffrage and colleagues suggest that physicians’ inferences about statistical outcomes are more appropriate when they deal with ‘natural frequencies’ – whole numbers of people, both treated and untreated (e.g. treatment results in a drop from 20 out of 1000 to 10 out of 1000 women having breast cancer) – than when effects are presented as percentages (e.g. 1% absolute reduction in breast cancer risk) (Hoffrage et al 2000). Probabilities may be more difficult to understand than frequencies, particularly when events are rare. While standardization may be important in improving the presentation of research evidence (and participation in healthcare decisions), current evidence suggests that the presentation of natural frequencies for expressing differences in absolute risk is best understood by consumers of healthcare information (Akl et al 2011b). This evidence provides the rationale for presenting absolute risks in ‘Summary of findings’ tables as numbers of people with events per 1000 people receiving the intervention (see Chapter 14).
RRs and RRRs remain crucial because relative effects tend to be substantially more stable across risk groups than absolute effects (see Chapter 10, Section 10.4.3). Review authors can use their own data to study this consistency (Cates 1999, Smeeth et al 1999). Risk differences from studies are least likely to be consistent across baseline event rates; thus, they are rarely appropriate for computing numbers needed to treat in systematic reviews. If a relative effect measure (OR or RR) is chosen for meta-analysis, then a comparator group risk needs to be specified as part of the calculation of an RD or NNT. In addition, if there are several different groups of participants with different levels of risk, it is crucial to express absolute benefit for each clinically identifiable risk group, clarifying the time period to which this applies. Studies in patients with differing severity of disease, or studies with different lengths of follow-up will almost certainly have different comparator group risks. In these cases, different comparator group risks lead to different RDs and NNTs (except when the intervention has no effect). A recommended approach is to re-express an odds ratio or a risk ratio as a variety of RD or NNTs across a range of assumed comparator risks (ACRs) (McQuay and Moore 1997, Smeeth et al 1999). Review authors should bear these considerations in mind not only when constructing their ‘Summary of findings’ table, but also in the text of their review.
For example, a review of oral anticoagulants to prevent stroke presented information to users by describing absolute benefits for various baseline risks (Aguilar and Hart 2005, Aguilar et al 2007). They presented their principal findings as “The inherent risk of stroke should be considered in the decision to use oral anticoagulants in atrial fibrillation patients, selecting those who stand to benefit most for this therapy” (Aguilar and Hart 2005). Among high-risk atrial fibrillation patients with prior stroke or transient ischaemic attack who have stroke rates of about 12% (120 per 1000) per year, warfarin prevents about 70 strokes yearly per 1000 patients, whereas for low-risk atrial fibrillation patients (with a stroke rate of about 2% per year or 20 per 1000), warfarin prevents only 12 strokes. This presentation helps users to understand the important impact that typical baseline risks have on the absolute benefit that they can expect.
15.4.4 Computations
Direct computation of risk difference (RD) or a number needed to treat (NNT) depends on the summary statistic (odds ratio, risk ratio or risk differences) available from the study or meta-analysis. When expressing results of meta-analyses, review authors should use, in the computations, whatever statistic they determined to be the most appropriate summary for meta-analysis (see Chapter 10, Section 10.4.3). Here we present calculations to obtain RD as a reduction in the number of participants per 1000. For example, a risk difference of –0.133 corresponds to 133 fewer participants with the event per 1000.
RDs and NNTs should not be computed from the aggregated total numbers of participants and events across the trials. This approach ignores the randomization within studies, and may produce seriously misleading results if there is unbalanced randomization in any of the studies. Using the pooled result of a meta-analysis is more appropriate. When computing NNTs, the values obtained are by convention always rounded up to the next whole number.
15.4.4.1 Computing NNT from a risk difference (RD)
A NNT may be computed from a risk difference as
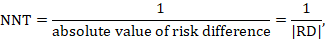
where the vertical bars (‘absolute value of’) in the denominator indicate that any minus sign should be ignored. It is convention to round the NNT up to the nearest whole number. For example, if the risk difference is –0.12 the NNT is 9; if the risk difference is –0.22 the NNT is 5. Cochrane Review authors should qualify the NNT as referring to benefit (improvement) or harm by denoting the NNT as NNTB or NNTH. Note that this approach, although feasible, should be used only for the results of a meta-analysis of risk differences. In most cases meta-analyses will be undertaken using a relative measure of effect (RR or OR), and those statistics should be used to calculate the NNT (see Section 15.4.4.2 and 15.4.4.3).
15.4.4.2 Computing risk differences or NNT from a risk ratio
To aid interpretation of the results of a meta-analysis of risk ratios, review authors may compute an absolute risk reduction or NNT. In order to do this, an assumed comparator risk (ACR) (otherwise known as a baseline risk, or risk that the outcome of interest would occur with the comparator intervention) is required. It will usually be appropriate to do this for a range of different ACRs. The computation proceeds as follows:

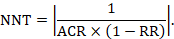
As an example, suppose the risk ratio is RR = 0.92, and an ACR = 0.3 (300 per 1000) is assumed. Then the effect on risk is 24 fewer per 1000:

The NNT is 42:

15.4.4.3 Computing risk differences or NNT from an odds ratio
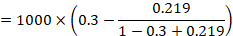
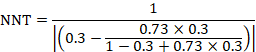
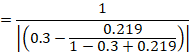
Review authors may wish to compute a risk difference or NNT from the results of a meta-analysis of odds ratios. In order to do this, an ACR is required. It will usually be appropriate to do this for a range of different ACRs. The computation proceeds as follows:

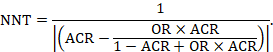
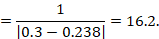
As an example, suppose the odds ratio is OR = 0.73, and a comparator risk of ACR = 0.3 is assumed. Then the effect on risk is 62 fewer per 1000:


The NNT is 17:
15.4.4.4 Computing risk ratio from an odds ratio
Because risk ratios are easier to interpret than odds ratios, but odds ratios have favourable mathematical properties, a review author may decide to undertake a meta-analysis based on odds ratios, but to express the result as a summary risk ratio (or relative risk reduction). This requires an ACR. Then
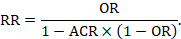
It will often be reasonable to perform this transformation using the median comparator group risk from the studies in the meta-analysis.
15.4.4.5 Computing confidence limits
Confidence limits for RDs and NNTs may be calculated by applying the above formulae to the upper and lower confidence limits for the summary statistic (RD, RR or OR) (Altman 1998). Note that this confidence interval does not incorporate uncertainty around the ACR.
If the 95% confidence interval of OR or RR includes the value 1, one of the confidence limits will indicate benefit and the other harm. Thus, appropriate use of the words ‘fewer’ and ‘more’ is required for each limit when presenting results in terms of events. For NNTs, the two confidence limits should be labelled as NNTB and NNTH to indicate the direction of effect in each case. The confidence interval for the NNT will include a ‘discontinuity’, because increasingly smaller risk differences that approach zero will lead to NNTs approaching infinity. Thus, the confidence interval will include both an infinitely large NNTB and an infinitely large NNTH.
15.5 Interpreting results from continuous outcomes (including standardized mean differences)
15.5.1 Meta-analyses with continuous outcomes
Review authors should describe in the study protocol how they plan to interpret results for continuous outcomes. When outcomes are continuous, review authors have a number of options to present summary results. These options differ if studies report the same measure that is familiar to the target audiences, studies report the same or very similar measures that are less familiar to the target audiences, or studies report different measures.
15.5.2 Meta-analyses with continuous outcomes using the same measure
If all studies have used the same familiar units, for instance, results are expressed as durations of events, such as symptoms for conditions including diarrhoea, sore throat, otitis media, influenza or duration of hospitalization, a meta-analysis may generate a summary estimate in those units, as a difference in mean response (see, for instance, the row summarizing results for duration of diarrhoea in Chapter 14, Figure 14.1.b and the row summarizing oedema in Chapter 14, Figure 14.1.a). For such outcomes, the ‘Summary of findings’ table should include a difference of means between the two interventions. However, when units of such outcomes may be difficult to interpret, particularly when they relate to rating scales (again, see the oedema row of Chapter 14, Figure 14.1.a). ‘Summary of findings’ tables should include the minimum and maximum of the scale of measurement, and the direction. Knowledge of the smallest change in instrument score that patients perceive is important – the minimal important difference (MID) – and can greatly facilitate the interpretation of results (Guyatt et al 1998, Schünemann and Guyatt 2005). Knowing the MID allows review authors and users to place results in context. Review authors should state the MID – if known – in the Comments column of their ‘Summary of findings’ table. For example, the chronic respiratory questionnaire has possible scores in health-related quality of life ranging from 1 to 7 and 0.5 represents a well-established MID (Jaeschke et al 1989, Schünemann et al 2005).
15.5.3 Meta-analyses with continuous outcomes using different measures
When studies have used different instruments to measure the same construct, a standardized mean difference (SMD) may be used in meta-analysis for combining continuous data. Without guidance, clinicians and patients may have little idea how to interpret results presented as SMDs. Review authors should therefore consider issues of interpretability when planning their analysis at the protocol stage and should consider whether there will be suitable ways to re-express the SMD or whether alternative effect measures, such as a ratio of means, or possibly as minimal important difference units (Guyatt et al 2013b) should be used. Table 15.5.a and the following sections describe these options.
Table 15.5.a Approaches and their implications to presenting results of continuous variables when primary studies have used different instruments to measure the same construct. Adapted from Guyatt et al (2013b)
|
Approach |
Observations about using the approach |
Recommendation |
|
Options for interpreting SMDs |
||
|
1a. Generic standard deviation (SD) units and guiding rules |
It is widely used, but the interpretation is challenging. It can be misleading depending on whether the population is very homogenous or heterogeneous (i.e. how variable the outcome was in the population of each included study, and therefore how applicable a standard SD is likely to be). See Section 15.5.3.1. |
Use together with other approaches below. |
|
1b. Re-express and present as units of a familiar measure |
Presenting data with this approach may be viewed by users as closer to the primary data. However, few instruments are sufficiently used in clinical practice to make many of the presented units easily interpretable. See Section 15.5.3.2. |
When the units and measures are familiar to the decision makers (e.g. healthcare providers and patients), this presentation should be seriously considered. Note: Conversion to natural units is also an option for expressing results using the MID approach below (row 3). |
|
1c. Re-express as result for a dichotomous outcome |
Dichotomous outcomes are very familiar to clinical audiences and may facilitate understanding. However, this approach involves assumptions that may not always be valid (e.g. it assumes that distributions in intervention and comparator group are roughly normally distributed and variances are similar). It allows applying GRADE guidance for large and very large effects. See Section 15.5.3.3. |
Consider this approach if the assumptions appear reasonable. If the minimal important difference for an instrument is known describing the probability of individuals achieving this difference may be more intuitive. Review authors should always seriously consider this option. Note: Re-expressing SMDs is not the only way of expressing results as dichotomous outcomes. For example, the actual outcomes in the studies can be dichotomized, either directly or using assumptions, prior to meta-analysis. |
|
Options based on other effect measures |
||
|
2. Ratio of means |
This approach may be easily interpretable to clinical audiences and involves fewer assumptions than some other approaches. It allows applying GRADE guidance for large and very large effects. It cannot be applied when measure is a change from baseline and therefore negative values possible and the interpretation requires knowledge and interpretation of comparator group mean. See Section 15.5.3.4 |
Consider as complementing other approaches, particularly the presentation of relative and absolute effects. |
|
3. Minimal important difference units |
This approach may be easily interpretable for audiences but is applicable only when minimal important differences are known. See Section 15.5.3.5. |
Consider as complementing other approaches, particularly the presentation of relative and absolute effects. |
15.5.3.1 Presenting and interpreting SMDs using generic effect size estimates
The SMD expresses the intervention effect in standard units rather than the original units of measurement. The SMD is the difference in mean effects between the experimental and comparator groups divided by the pooled standard deviation of participants’ outcomes, or external SDs when studies are very small (see Chapter 6, Section 6.5.1.2). The value of a SMD thus depends on both the size of the effect (the difference between means) and the standard deviation of the outcomes (the inherent variability among participants or based on an external SD).
If review authors use the SMD, they might choose to present the results directly as SMDs (row 1a, Table 15.5.a and Table 15.5.b). However, absolute values of the intervention and comparison groups are typically not useful because studies have used different measurement instruments with different units. Guiding rules for interpreting SMDs (or ‘Cohen’s effect sizes’) exist, and have arisen mainly from researchers in the social sciences (Cohen 1988). One example is as follows: 0.2 represents a small effect, 0.5 a moderate effect and 0.8 a large effect (Cohen 1988). Variations exist (e.g. <0.40=small, 0.40 to 0.70=moderate, >0.70=large). Review authors might consider including such a guiding rule in interpreting the SMD in the text of the review, and in summary versions such as the Comments column of a ‘Summary of findings’ table. However, some methodologists believe that such interpretations are problematic because patient importance of a finding is context-dependent and not amenable to generic statements.
15.5.3.2 Re-expressing SMDs using a familiar instrument
The second possibility for interpreting the SMD is to express it in the units of one or more of the specific measurement instruments used by the included studies (row 1b, Table 15.5.a and Table 15.5.b). The approach is to calculate an absolute difference in means by multiplying the SMD by an estimate of the SD associated with the most familiar instrument. To obtain this SD, a reasonable option is to calculate a weighted average across all intervention groups of all studies that used the selected instrument (preferably a pre-intervention or post-intervention SD as discussed in Chapter 10, Section 10.5.2). To better reflect among-person variation in practice, or to use an instrument not represented in the meta-analysis, it may be preferable to use a standard deviation from a representative observational study. The summary effect is thus re-expressed in the original units of that particular instrument and the clinical relevance and impact of the intervention effect can be interpreted using that familiar instrument.
The same approach of re-expressing the results for a familiar instrument can also be used for other standardized effect measures such as when standardizing by MIDs (Guyatt et al 2013b): see Section 15.5.3.5.
Table 15.5.b Application of approaches when studies have used different measures: effects of dexamethasone for pain after laparoscopic cholecystectomy (Karanicolas et al 2008). Reproduced with permission of Wolters Kluwer
|
Options for presenting information about the outcome post-operative pain and suggested description of the measure |
|
Relative effect (95% CI) |
Number of participants (studies) |
Certainty of evidence1
|
Comments |
|
|
Estimated risk or estimated score/value with placebo |
Risk difference or relative reduction in score/value with dexamethasone
|
|||||
|
|
|
|||||
|
1a. Post-operative pain, standard deviation units Investigators measured pain using different instruments. Lower scores mean less pain. |
The pain score in the dexamethasone groups was on average 0.79 SDs (1.41 to 0.17) lower than in the placebo groups). |
– |
539 (5) |
⊕⊕OO2,3 Low |
As a rule of thumb, 0.2 SD represents a small difference, 0.5 a moderate and 0.8 a large. |
|
|
1b. Post-operative pain Measured on a scale from 0, no pain, to 100, worst pain imaginable. |
The mean post-operative pain scores with placebo ranged from 43 to 54. |
The mean pain score in the intervention groups was on average 8.1 (1.8 to 14.5) lower.
|
– |
539 (5) |
⊕⊕OO Low2,3 |
Scores calculated based on an SMD of 0.79 (95% CI –1.41 to –0.17) and rescaled to a 0 to 100 pain scale. The minimal important difference on the 0 to 100 pain scale is approximately 10. |
|
1c. Substantial post-operative pain, dichotomized Investigators measured pain using different instruments. |
20 per 1004 |
15 more (4 more to 18 more) per 100 patients in dexamethasone group achieved important improvement in the pain score. |
RR = 0.25 (95% CI 0.05 to 0.75) |
539 (5) |
⊕⊕OO2,3 Low |
Scores estimated based on an SMD of 0.79 (95% CI –1.41 to –0.17).
|
|
2. Post-operative pain Investigators measured pain using different instruments. Lower scores mean less pain. |
The mean post-operative pain scores with placebo was 28.1.5 |
On average a 3.7 lower pain score (0.6 to 6.1 lower) |
Ratio of means 0.87 (0.78 to 0.98) |
539 (5) |
⊕⊕OO2,3 Low |
Weighted average of the mean pain score in dexamethasone group divided by mean pain score in placebo. |
|
3. Post-operative pain Investigators measured pain using different instruments. |
The pain score in the dexamethasone groups was on average 0.40 (95% CI 0.74 to 0.07) minimal important difference units less than the control group. |
– |
539 (5) |
⊕⊕OO2,3 Low |
An effect less than half the minimal important difference suggests a small or very small effect. |
|
1 Certainty rated according to GRADE from very low to high certainty.
2 Substantial unexplained heterogeneity in study results.
3 Imprecision due to wide confidence intervals.
4 The 20% comes from the proportion in the control group requiring rescue analgesia.
5 Crude (arithmetic) means of the post-operative pain mean responses across all five trials when transformed to a 100-point scale.
15.5.3.3 Re-expressing SMDs through dichotomization and transformation to relative and absolute measures
A third approach (row 1c, Table 15.5.a and Table 15.5.b) relies on converting the continuous measure into a dichotomy and thus allows calculation of relative and absolute effects on a binary scale. A transformation of a SMD to a (log) odds ratio is available, based on the assumption that an underlying continuous variable has a logistic distribution with equal standard deviation in the two intervention groups, as discussed in Chapter 10, Section 10.6 (Furukawa 1999, Guyatt et al 2013b). The assumption is unlikely to hold exactly and the results must be regarded as an approximation. The log odds ratio is estimated as

(or approximately 1.81✕SMD). The resulting odds ratio can then be presented as normal, and in a ‘Summary of findings’ table, combined with an assumed comparator group risk to be expressed as an absolute risk difference. The comparator group risk in this case would refer to the proportion of people who have achieved a specific value of the continuous outcome. In randomized trials this can be interpreted as the proportion who have improved by some (specified) amount (responders), for instance by 5 points on a 0 to 100 scale. Table 15.5.c shows some illustrative results from this method. The risk differences can then be converted to NNTs or to people per thousand using methods described in Section 15.4.4.
Table 15.5.c Risk difference derived for specific SMDs for various given ‘proportions improved’ in the comparator group (Furukawa 1999, Guyatt et al 2013b). Reproduced with permission of Elsevier
|
Comparator group response proportion |
0.1 |
0.2 |
0.3 |
0.4 |
0.5 |
0.6 |
0.7 |
0.8 |
0.9 |
||||||||
|
Situations in which the event is undesirable, reduction (or increase if intervention harmful) in adverse events with the intervention |
|||||||||||||||||
|
SMD = −0.2 |
−3% |
−5% |
−7% |
−8% |
−8% |
−8% |
−7% |
−6% |
−4% |
||||||||
|
SMD = −0.5 |
−6% |
−11% |
−15% |
−17% |
−19% |
−20% |
−20% |
−17% |
−12% |
||||||||
|
SMD = −0.8 |
−8% |
−15% |
−21% |
−25% |
−29% |
−31% |
−31% |
−28% |
−22% |
||||||||
|
SMD = −1.0 |
−9% |
−17% |
−24% |
−23% |
−34% |
−37% |
−38% |
−36% |
−29% |
||||||||
|
Situations in which the event is desirable, increase (or decrease if intervention harmful) in positive responses to the intervention |
|||||||||||||||||
|
SMD = 0.2 |
4% |
6% |
7% |
8% |
8% |
8% |
7% |
5% |
3% |
||||||||
|
SMD = 0.5 |
12% |
17% |
19% |
20% |
19% |
17% |
15% |
11% |
6% |
||||||||
|
SMD = 0.8 |
22% |
28% |
31% |
31% |
29% |
25% |
21% |
15% |
8% |
||||||||
|
SMD = 1.0 |
29% |
36% |
38% |
38% |
34% |
30% |
24% |
17% |
9% |
||||||||
15.5.3.4 Ratio of means
A more frequently used approach is based on calculation of a ratio of means between the intervention and comparator groups (Friedrich et al 2008) as discussed in Chapter 6, Section 6.5.1.3. Interpretational advantages of this approach include the ability to pool studies with outcomes expressed in different units directly, to avoid the vulnerability of heterogeneous populations that limits approaches that rely on SD units, and for ease of clinical interpretation (row 2, Table 15.5.a and Table 15.5.b). This method is currently designed for post-intervention scores only. However, it is possible to calculate a ratio of change scores if both intervention and comparator groups change in the same direction in each relevant study, and this ratio may sometimes be informative.
Limitations to this approach include its limited applicability to change scores (since it is unlikely that both intervention and comparator group changes are in the same direction in all studies) and the possibility of misleading results if the comparator group mean is very small, in which case even a modest difference from the intervention group will yield a large and therefore misleading ratio of means. It also requires that separate ratios of means be calculated for each included study, and then entered into a generic inverse variance meta-analysis (see Chapter 10, Section 10.3).
The ratio of means approach illustrated in Table 15.5.b suggests a relative reduction in pain of only 13%, meaning that those receiving steroids have a pain severity 87% of those in the comparator group, an effect that might be considered modest.
15.5.3.5 Presenting continuous results as minimally important difference units
To express results in MID units, review authors have two options. First, they can be combined across studies in the same way as the SMD, but instead of dividing the mean difference of each study by its SD, review authors divide by the MID associated with that outcome (Johnston et al 2010, Guyatt et al 2013b). Instead of SD units, the pooled results represent MID units (row 3, Table 15.5.a and Table 15.5.b), and may be more easily interpretable. This approach avoids the problem of varying SDs across studies that may distort estimates of effect in approaches that rely on the SMD. The approach, however, relies on having well-established MIDs. The approach is also risky in that a difference less than the MID may be interpreted as trivial when a substantial proportion of patients may have achieved an important benefit.
The other approach makes a simple conversion (not shown in Table 15.5.b), before undertaking the meta-analysis, of the means and SDs from each study to means and SDs on the scale of a particular familiar instrument whose MID is known. For example, one can rescale the mean and SD of other chronic respiratory disease instruments (e.g. rescaling a 0 to 100 score of an instrument) to a the 1 to 7 score in Chronic Respiratory Disease Questionnaire (CRQ) units (by assuming 0 equals 1 and 100 equals 7 on the CRQ). Given the MID of the CRQ of 0.5, a mean difference in change of 0.71 after rescaling of all studies suggests a substantial effect of the intervention (Guyatt et al 2013b). This approach, presenting in units of the most familiar instrument, may be the most desirable when the target audiences have extensive experience with that instrument, particularly if the MID is well established.
15.6 Drawing conclusions
15.6.1 Conclusions sections of a Cochrane Review
Authors’ conclusions in a Cochrane Review are divided into implications for practice and implications for research. While Cochrane Reviews about interventions can provide meaningful information and guidance for practice, decisions about the desirable and undesirable consequences of healthcare options require evidence and judgements for criteria that most Cochrane Reviews do not provide (Alonso-Coello et al 2016). In describing the implications for practice and the development of recommendations, however, review authors may consider the certainty of the evidence, the balance of benefits and harms, and assumed values and preferences.
15.6.2 Implications for practice
Drawing conclusions about the practical usefulness of an intervention entails making trade-offs, either implicitly or explicitly, between the estimated benefits, harms and the values and preferences. Making such trade-offs, and thus making specific recommendations for an action in a specific context, goes beyond a Cochrane Review and requires additional evidence and informed judgements that most Cochrane Reviews do not provide (Alonso-Coello et al 2016). Such judgements are typically the domain of clinical practice guideline developers for which Cochrane Reviews will provide crucial information (Graham et al 2011, Schünemann et al 2014, Zhang et al 2018a). Thus, authors of Cochrane Reviews should not make recommendations.
If review authors feel compelled to lay out actions that clinicians and patients could take, they should – after describing the certainty of evidence and the balance of benefits and harms – highlight different actions that might be consistent with particular patterns of values and preferences. Other factors that might influence a decision should also be highlighted, including any known factors that would be expected to modify the effects of the intervention, the baseline risk or status of the patient, costs and who bears those costs, and the availability of resources. Review authors should ensure they consider all patient-important outcomes, including those for which limited data may be available. In the context of public health reviews the focus may be on population-important outcomes as the target may be an entire (non-diseased) population and include outcomes that are not measured in the population receiving an intervention (e.g. a reduction of transmission of infections from those receiving an intervention). This process implies a high level of explicitness in judgements about values or preferences attached to different outcomes and the certainty of the related evidence (Zhang et al 2018b, Zhang et al 2018c); this and a full cost-effectiveness analysis is beyond the scope of most Cochrane Reviews (although they might well be used for such analyses; see Chapter 20).
A review on the use of anticoagulation in cancer patients to increase survival (Akl et al 2011a) provides an example for laying out clinical implications for situations where there are important trade-offs between desirable and undesirable effects of the intervention: “The decision for a patient with cancer to start heparin therapy for survival benefit should balance the benefits and downsides and integrate the patient’s values and preferences. Patients with a high preference for a potential survival prolongation, limited aversion to potential bleeding, and who do not consider heparin (both UFH or LMWH) therapy a burden may opt to use heparin, while those with aversion to bleeding may not.”
15.6.3 Implications for research
The second category for authors’ conclusions in a Cochrane Review is implications for research. To help people make well-informed decisions about future healthcare research, the ‘Implications for research’ section should comment on the need for further research, and the nature of the further research that would be most desirable. It is helpful to consider the population, intervention, comparison and outcomes that could be addressed, or addressed more effectively in the future, in the context of the certainty of the evidence in the current review (Brown et al 2006):
- P (Population): diagnosis, disease stage, comorbidity, risk factor, sex, age, ethnic group, specific inclusion or exclusion criteria, clinical setting;
- I (Intervention): type, frequency, dose, duration, prognostic factor;
- C (Comparison): placebo, routine care, alternative treatment/management;
- O (Outcome): which clinical or patient-related outcomes will the researcher need to measure, improve, influence or accomplish? Which methods of measurement should be used?
While Cochrane Review authors will find the PICO domains helpful, the domains of the GRADE certainty framework further support understanding and describing what additional research will improve the certainty in the available evidence. Note that as the certainty of the evidence is likely to vary by outcome, these implications will be specific to certain outcomes in the review. Table 15.6.a shows how review authors may be aided in their interpretation of the body of evidence and drawing conclusions about future research and practice.
Table 15.6.a Implications for research and practice suggested by individual GRADE domains
|
Domain |
Implications for research |
Examples for research statements |
Implications for practice |
|
Risk of bias |
Need for methodologically better designed and executed studies. |
All studies suffered from lack of blinding of outcome assessors. Trials of this type are required. |
The estimates of effect may be biased because of a lack of blinding of the assessors of the outcome. |
|
Inconsistency |
Unexplained inconsistency: need for individual participant data meta-analysis; need for studies in relevant subgroups. |
Studies in patients with small cell lung cancer are needed to understand if the effects differ from those in patients with pancreatic cancer. |
Unexplained inconsistency: consider and interpret overall effect estimates as for the overall certainty of a body of evidence. Explained inconsistency (if results are not presented in strata): consider and interpret effects estimates by subgroup. |
|
Indirectness |
Need for studies that better fit the PICO question of interest. |
Studies in patients with early cancer are needed because the evidence is from studies in patients with advanced cancer. |
It is uncertain if the results directly apply to the patients or the way that the intervention is applied in a particular setting. |
|
Imprecision |
Need for more studies with more participants to reach optimal information size. |
Studies with approximately 200 more events in the experimental intervention group and the comparator intervention group are required. |
Same uncertainty interpretation as for certainty of a body of evidence: e.g. the true effect may be substantially different. |
|
Publication bias |
Need to investigate and identify unpublished data; large studies might help resolve this issue. |
Large studies are required. |
Same uncertainty interpretation as for certainty of a body of evidence (e.g. the true effect may be substantially different). |
|
Large effects |
No direct implications. |
Not applicable. |
The effect is large in the populations that were included in the studies and the true effect is likely going to cross important thresholds. |
|
Dose effects |
No direct implications. |
Not applicable. |
The greater the reduction in the exposure the larger is the expected harm (or benefit). |
|
Opposing bias and confounding |
Studies controlling for the residual bias and confounding are needed. |
Studies controlling for possible confounders such as smoking and degree of education are required. |
The effect could be even larger or smaller (depending on the direction of the results) than the one that is observed in the studies presented here. |
The review of compression stockings for prevention of deep vein thrombosis (DVT) in airline passengers described in Chapter 14 provides an example where there is some convincing evidence of a benefit of the intervention: “This review shows that the question of the effects on symptomless DVT of wearing versus not wearing compression stockings in the types of people studied in these trials should now be regarded as answered. Further research may be justified to investigate the relative effects of different strengths of stockings or of stockings compared to other preventative strategies. Further randomised trials to address the remaining uncertainty about the effects of wearing versus not wearing compression stockings on outcomes such as death, pulmonary embolism and symptomatic DVT would need to be large.” (Clarke et al 2016).
A review of therapeutic touch for anxiety disorder provides an example of the implications for research when no eligible studies had been found: “This review highlights the need for randomized controlled trials to evaluate the effectiveness of therapeutic touch in reducing anxiety symptoms in people diagnosed with anxiety disorders. Future trials need to be rigorous in design and delivery, with subsequent reporting to include high quality descriptions of all aspects of methodology to enable appraisal and interpretation of results.” (Robinson et al 2007).
15.6.4 Reaching conclusions
A common mistake is to confuse ‘no evidence of an effect’ with ‘evidence of no effect’. When the confidence intervals are too wide (e.g. including no effect), it is wrong to claim that the experimental intervention has ‘no effect’ or is ‘no different’ from the comparator intervention. Review authors may also incorrectly ‘positively’ frame results for some effects but not others. For example, when the effect estimate is positive for a beneficial outcome but confidence intervals are wide, review authors may describe the effect as promising. However, when the effect estimate is negative for an outcome that is considered harmful but the confidence intervals include no effect, review authors report no effect. Another mistake is to frame the conclusion in wishful terms. For example, review authors might write, “there were too few people in the analysis to detect a reduction in mortality” when the included studies showed a reduction or even increase in mortality that was not ‘statistically significant’. One way of avoiding errors such as these is to consider the results blinded; that is, consider how the results would be presented and framed in the conclusions if the direction of the results was reversed. If the confidence interval for the estimate of the difference in the effects of the interventions overlaps with no effect, the analysis is compatible with both a true beneficial effect and a true harmful effect. If one of the possibilities is mentioned in the conclusion, the other possibility should be mentioned as well. Table 15.6.b suggests narrative statements for drawing conclusions based on the effect estimate from the meta-analysis and the certainty of the evidence.
Table 15.6.b Suggested narrative statements for phrasing conclusions
|
Size of the effect estimate |
Suggested statements for conclusions (replace X with intervention, choose ‘reduce’ or ‘increase’ depending on the direction of the effect, replace ‘outcome’ with name of outcome, include ‘when compared with Y’ when needed) |
|
High certainty of the evidence |
|
|
Large effect |
X results in a large reduction/increase in outcome |
|
Moderate effect |
X reduces/increases outcome X results in a reduction/increase in outcome |
|
Small important effect |
X reduces/increases outcome slightly X results in a slight reduction/increase in outcome |
|
Trivial, small unimportant effect or no effect |
X results in little to no difference in outcome X does not reduce/increase outcome |
|
Moderate certainty of the evidence |
|
|
Large effect |
X likely results in a large reduction/increase in outcome X probably results in a large reduction/increase in outcome |
|
Moderate effect |
X likely reduces/increases outcome X probably reduces/increases outcome X likely results in a reduction/increase in outcome X probably results in a reduction/increase in outcome |
|
Small important effect |
X probably reduces/increases outcome slightly X likely reduces/increases outcome slightly X probably results in a slight reduction/increase in outcome X likely results in a slight reduction/increase in outcome |
|
Trivial, small unimportant effect or no effect |
X likely results in little to no difference in outcome X probably results in little to no difference in outcome X likely does not reduce/increase outcome X probably does not reduce/increase outcome |
|
Low certainty of the evidence |
|
|
Large effect |
X may result in a large reduction/increase in outcome The evidence suggests X results in a large reduction/increase in outcome |
|
Moderate effect |
X may reduce/increase outcome The evidence suggests X reduces/increases outcome X may result in a reduction/increase in outcome The evidence suggests X results in a reduction/increase in outcome |
|
Small important effect |
X may reduce/increase outcome slightly The evidence suggests X reduces/increases outcome slightly X may result in a slight reduction/increase in outcome The evidence suggests X results in a slight reduction/increase in outcome |
|
Trivial, small unimportant effect or no effect |
X may result in little to no difference in outcome The evidence suggests that X results in little to no difference in outcome X may not reduce/increase outcome The evidence suggests that X does not reduce/increase outcome |
|
Very low certainty of the evidence |
|
|
Any effect |
The evidence is very uncertain about the effect of X on outcome X may reduce/increase/have little to no effect on outcome but the evidence is very uncertain |
Another common mistake is to reach conclusions that go beyond the evidence. Often this is done implicitly, without referring to the additional information or judgements that are used in reaching conclusions about the implications of a review for practice. Even when additional information and explicit judgements support conclusions about the implications of a review for practice, review authors rarely conduct systematic reviews of the additional information. Furthermore, implications for practice are often dependent on specific circumstances and values that must be taken into consideration. As we have noted, review authors should always be cautious when drawing conclusions about implications for practice and they should not make recommendations.
15.7 Chapter information
Authors: Holger J Schünemann, Gunn E Vist, Julian PT Higgins, Nancy Santesso, Jonathan J Deeks, Paul Glasziou, Elie Akl, Gordon H Guyatt; on behalf of the Cochrane GRADEing Methods Group
Acknowledgements: Andrew Oxman, Jonathan Sterne, Michael Borenstein and Rob Scholten contributed text to earlier versions of this chapter.
Funding: This work was in part supported by funding from the Michael G DeGroote Cochrane Canada Centre and the Ontario Ministry of Health. JJD receives support from the National Institute for Health Research (NIHR) Birmingham Biomedical Research Centre at the University Hospitals Birmingham NHS Foundation Trust and the University of Birmingham. JPTH receives support from the NIHR Biomedical Research Centre at University Hospitals Bristol NHS Foundation Trust and the University of Bristol. The views expressed are those of the author(s) and not necessarily those of the NHS, the NIHR or the Department of Health.
15.8 References
Aguilar MI, Hart R. Oral anticoagulants for preventing stroke in patients with non-valvular atrial fibrillation and no previous history of stroke or transient ischemic attacks. Cochrane Database of Systematic Reviews 2005; 3: CD001927.
Aguilar MI, Hart R, Pearce LA. Oral anticoagulants versus antiplatelet therapy for preventing stroke in patients with non-valvular atrial fibrillation and no history of stroke or transient ischemic attacks. Cochrane Database of Systematic Reviews 2007; 3: CD006186.
Akl EA, Gunukula S, Barba M, Yosuico VE, van Doormaal FF, Kuipers S, Middeldorp S, Dickinson HO, Bryant A, Schünemann H. Parenteral anticoagulation in patients with cancer who have no therapeutic or prophylactic indication for anticoagulation. Cochrane Database of Systematic Reviews 2011a; 1: CD006652.
Akl EA, Oxman AD, Herrin J, Vist GE, Terrenato I, Sperati F, Costiniuk C, Blank D, Schünemann H. Using alternative statistical formats for presenting risks and risk reductions. Cochrane Database of Systematic Reviews 2011b; 3: CD006776.
Alonso-Coello P, Schünemann HJ, Moberg J, Brignardello-Petersen R, Akl EA, Davoli M, Treweek S, Mustafa RA, Rada G, Rosenbaum S, Morelli A, Guyatt GH, Oxman AD, Group GW. GRADE Evidence to Decision (EtD) frameworks: a systematic and transparent approach to making well informed healthcare choices. 1: Introduction. BMJ 2016; 353: i2016.
Altman DG. Confidence intervals for the number needed to treat. BMJ 1998; 317: 1309-1312.
Atkins D, Best D, Briss PA, Eccles M, Falck-Ytter Y, Flottorp S, Guyatt GH, Harbour RT, Haugh MC, Henry D, Hill S, Jaeschke R, Leng G, Liberati A, Magrini N, Mason J, Middleton P, Mrukowicz J, O'Connell D, Oxman AD, Phillips B, Schünemann HJ, Edejer TT, Varonen H, Vist GE, Williams JW, Jr., Zaza S. Grading quality of evidence and strength of recommendations. BMJ 2004; 328: 1490.
Brown P, Brunnhuber K, Chalkidou K, Chalmers I, Clarke M, Fenton M, Forbes C, Glanville J, Hicks NJ, Moody J, Twaddle S, Timimi H, Young P. How to formulate research recommendations. BMJ 2006; 333: 804-806.
Cates C. Confidence intervals for the number needed to treat: Pooling numbers needed to treat may not be reliable. BMJ 1999; 318: 1764-1765.
Clarke MJ, Broderick C, Hopewell S, Juszczak E, Eisinga A. Compression stockings for preventing deep vein thrombosis in airline passengers. Cochrane Database of Systematic Reviews 2016; 9: CD004002.
Cohen J. Statistical Power Analysis in the Behavioral Sciences. 2nd edition ed. Hillsdale (NJ): Lawrence Erlbaum Associates, Inc.; 1988.
Coleman T, Chamberlain C, Davey MA, Cooper SE, Leonardi-Bee J. Pharmacological interventions for promoting smoking cessation during pregnancy. Cochrane Database of Systematic Reviews 2015; 12: CD010078.
Dans AM, Dans L, Oxman AD, Robinson V, Acuin J, Tugwell P, Dennis R, Kang D. Assessing equity in clinical practice guidelines. Journal of Clinical Epidemiology 2007; 60: 540-546.
Friedman LM, Furberg CD, DeMets DL. Fundamentals of Clinical Trials. 2nd edition ed. Littleton (MA): John Wright PSG, Inc.; 1985.
Friedrich JO, Adhikari NK, Beyene J. The ratio of means method as an alternative to mean differences for analyzing continuous outcome variables in meta-analysis: a simulation study. BMC Medical Research Methodology 2008; 8: 32.
Furukawa T. From effect size into number needed to treat. Lancet 1999; 353: 1680.
Graham R, Mancher M, Wolman DM, Greenfield S, Steinberg E. Committee on Standards for Developing Trustworthy Clinical Practice Guidelines, Board on Health Care Services: Clinical Practice Guidelines We Can Trust. Washington, DC: National Academies Press; 2011.
Guyatt G, Oxman AD, Akl EA, Kunz R, Vist G, Brozek J, Norris S, Falck-Ytter Y, Glasziou P, DeBeer H, Jaeschke R, Rind D, Meerpohl J, Dahm P, Schünemann HJ. GRADE guidelines: 1. Introduction-GRADE evidence profiles and summary of findings tables. Journal of Clinical Epidemiology 2011a; 64: 383-394.
Guyatt GH, Juniper EF, Walter SD, Griffith LE, Goldstein RS. Interpreting treatment effects in randomised trials. BMJ 1998; 316: 690-693.
Guyatt GH, Oxman AD, Vist GE, Kunz R, Falck-Ytter Y, Alonso-Coello P, Schünemann HJ. GRADE: an emerging consensus on rating quality of evidence and strength of recommendations. BMJ 2008; 336: 924-926.
Guyatt GH, Oxman AD, Kunz R, Woodcock J, Brozek J, Helfand M, Alonso-Coello P, Falck-Ytter Y, Jaeschke R, Vist G, Akl EA, Post PN, Norris S, Meerpohl J, Shukla VK, Nasser M, Schünemann HJ. GRADE guidelines: 8. Rating the quality of evidence--indirectness. Journal of Clinical Epidemiology 2011b; 64: 1303-1310.
Guyatt GH, Oxman AD, Santesso N, Helfand M, Vist G, Kunz R, Brozek J, Norris S, Meerpohl J, Djulbegovic B, Alonso-Coello P, Post PN, Busse JW, Glasziou P, Christensen R, Schünemann HJ. GRADE guidelines: 12. Preparing summary of findings tables-binary outcomes. Journal of Clinical Epidemiology 2013a; 66: 158-172.
Guyatt GH, Thorlund K, Oxman AD, Walter SD, Patrick D, Furukawa TA, Johnston BC, Karanicolas P, Akl EA, Vist G, Kunz R, Brozek J, Kupper LL, Martin SL, Meerpohl JJ, Alonso-Coello P, Christensen R, Schünemann HJ. GRADE guidelines: 13. Preparing summary of findings tables and evidence profiles-continuous outcomes. Journal of Clinical Epidemiology 2013b; 66: 173-183.
Hawe P, Shiell A, Riley T, Gold L. Methods for exploring implementation variation and local context within a cluster randomised community intervention trial. Journal of Epidemiology and Community Health 2004; 58: 788-793.
Hoffrage U, Lindsey S, Hertwig R, Gigerenzer G. Medicine. Communicating statistical information. Science 2000; 290: 2261-2262.
Jaeschke R, Singer J, Guyatt GH. Measurement of health status. Ascertaining the minimal clinically important difference. Controlled Clinical Trials 1989; 10: 407-415.
Johnston B, Thorlund K, Schünemann H, Xie F, Murad M, Montori V, Guyatt G. Improving the interpretation of health-related quality of life evidence in meta-analysis: The application of minimal important difference units. . Health Outcomes and Qualithy of Life 2010; 11: 116.
Karanicolas PJ, Smith SE, Kanbur B, Davies E, Guyatt GH. The impact of prophylactic dexamethasone on nausea and vomiting after laparoscopic cholecystectomy: a systematic review and meta-analysis. Annals of Surgery 2008; 248: 751-762.
Lumley J, Oliver SS, Chamberlain C, Oakley L. Interventions for promoting smoking cessation during pregnancy. Cochrane Database of Systematic Reviews 2004; 4: CD001055.
McQuay HJ, Moore RA. Using numerical results from systematic reviews in clinical practice. Annals of Internal Medicine 1997; 126: 712-720.
Resnicow K, Cross D, Wynder E. The Know Your Body program: a review of evaluation studies. Bulletin of the New York Academy of Medicine 1993; 70: 188-207.
Robinson J, Biley FC, Dolk H. Therapeutic touch for anxiety disorders. Cochrane Database of Systematic Reviews 2007; 3: CD006240.
Rothwell PM. External validity of randomised controlled trials: "to whom do the results of this trial apply?". Lancet 2005; 365: 82-93.
Santesso N, Carrasco-Labra A, Langendam M, Brignardello-Petersen R, Mustafa RA, Heus P, Lasserson T, Opiyo N, Kunnamo I, Sinclair D, Garner P, Treweek S, Tovey D, Akl EA, Tugwell P, Brozek JL, Guyatt G, Schünemann HJ. Improving GRADE evidence tables part 3: detailed guidance for explanatory footnotes supports creating and understanding GRADE certainty in the evidence judgments. Journal of Clinical Epidemiology 2016; 74: 28-39.
Schünemann HJ, Puhan M, Goldstein R, Jaeschke R, Guyatt GH. Measurement properties and interpretability of the Chronic respiratory disease questionnaire (CRQ). COPD: Journal of Chronic Obstructive Pulmonary Disease 2005; 2: 81-89.
Schünemann HJ, Guyatt GH. Commentary--goodbye M(C)ID! Hello MID, where do you come from? Health Services Research 2005; 40: 593-597.
Schünemann HJ, Fretheim A, Oxman AD. Improving the use of research evidence in guideline development: 13. Applicability, transferability and adaptation. Health Research Policy and Systems 2006; 4: 25.
Schünemann HJ. Methodological idiosyncracies, frameworks and challenges of non-pharmaceutical and non-technical treatment interventions. Zeitschrift für Evidenz, Fortbildung und Qualität im Gesundheitswesen 2013; 107: 214-220.
Schünemann HJ, Tugwell P, Reeves BC, Akl EA, Santesso N, Spencer FA, Shea B, Wells G, Helfand M. Non-randomized studies as a source of complementary, sequential or replacement evidence for randomized controlled trials in systematic reviews on the effects of interventions. Research Synthesis Methods 2013; 4: 49-62.
Schünemann HJ, Wiercioch W, Etxeandia I, Falavigna M, Santesso N, Mustafa R, Ventresca M, Brignardello-Petersen R, Laisaar KT, Kowalski S, Baldeh T, Zhang Y, Raid U, Neumann I, Norris SL, Thornton J, Harbour R, Treweek S, Guyatt G, Alonso-Coello P, Reinap M, Brozek J, Oxman A, Akl EA. Guidelines 2.0: systematic development of a comprehensive checklist for a successful guideline enterprise. CMAJ: Canadian Medical Association Journal 2014; 186: E123-142.
Schünemann HJ. Interpreting GRADE's levels of certainty or quality of the evidence: GRADE for statisticians, considering review information size or less emphasis on imprecision? Journal of Clinical Epidemiology 2016; 75: 6-15.
Smeeth L, Haines A, Ebrahim S. Numbers needed to treat derived from meta-analyses--sometimes informative, usually misleading. BMJ 1999; 318: 1548-1551.
Sun X, Briel M, Busse JW, You JJ, Akl EA, Mejza F, Bala MM, Bassler D, Mertz D, Diaz-Granados N, Vandvik PO, Malaga G, Srinathan SK, Dahm P, Johnston BC, Alonso-Coello P, Hassouneh B, Walter SD, Heels-Ansdell D, Bhatnagar N, Altman DG, Guyatt GH. Credibility of claims of subgroup effects in randomised controlled trials: systematic review. BMJ 2012; 344: e1553.
Zhang Y, Akl EA, Schünemann HJ. Using systematic reviews in guideline development: the GRADE approach. Research Synthesis Methods 2018a: doi: 10.1002/jrsm.1313.
Zhang Y, Alonso-Coello P, Guyatt GH, Yepes-Nunez JJ, Akl EA, Hazlewood G, Pardo-Hernandez H, Etxeandia-Ikobaltzeta I, Qaseem A, Williams JW, Jr., Tugwell P, Flottorp S, Chang Y, Zhang Y, Mustafa RA, Rojas MX, Schünemann HJ. GRADE Guidelines: 19. Assessing the certainty of evidence in the importance of outcomes or values and preferences-Risk of bias and indirectness. Journal of Clinical Epidemiology 2018b: doi: 10.1016/j.jclinepi.2018.1001.1013.
Zhang Y, Alonso Coello P, Guyatt G, Yepes-Nunez JJ, Akl EA, Hazlewood G, Pardo-Hernandez H, Etxeandia-Ikobaltzeta I, Qaseem A, Williams JW, Jr., Tugwell P, Flottorp S, Chang Y, Zhang Y, Mustafa RA, Rojas MX, Xie F, Schünemann HJ. GRADE Guidelines: 20. Assessing the certainty of evidence in the importance of outcomes or values and preferences - Inconsistency, Imprecision, and other Domains. Journal of Clinical Epidemiology 2018c: doi: 10.1016/j.jclinepi.2018.1005.1011.